How to View Google Gemini Costs
Get the most granular view of Gemini costs all in one place with Vantage.
In the past year, Google’s AI offerings have undergone massive changes through new offerings and rebranding, which has in turn made cost tracking more complex than it needs to be. Google’s pricing tools often provide fragmented views, making it difficult to understand your overall AI costs. In addition, costs are not shown at the granular level that is needed to truly understand and allocate costs.
You can see all Gemini costs in one consolidated view using Vantage or view costs filtered and grouped by several dimensions, such as by team, model, or custom tag. You can get an even bigger picture by reporting on costs alongside other services or even alongside AI services from other providers (e.g., AWS Bedrock). With these visibility measures, you can make informed decisions and optimize your costs.
Prerequisites to View Gemini Costs
Vantage is a cloud cost visibility and optimization platform that makes it easy for you to view your cloud costs, as granular as your use case requires. With Vantage, you can see costs from 14+ providers, including Google Cloud, and from there you can filter to view your Gemini charges. To get started, you'll need to have or set up:
- A Vantage account.
- A Google Cloud integration.
Note—getting set up is simple and only takes a few minutes.
See All Gemini Costs
The Gemini API is available through Google Cloud in two ways—Google AI Studio or Google Cloud Vertex AI. The former is sufficient for experimentation and prototyping. The latter is recommended for production workloads and scaling. Both are priced on different dimensions and are billed through different platforms.
You can see all your Gemini costs in one place with Vantage by following these steps to create a Cost Report:
First, create a Cost Report and filter the Vertex AI Gemini services.
- From the top navigation, click Cost Reporting.
- On the top right, click + New. A new, unfiltered Cost Report is displayed with your month-to-date costs.
- From the top left of the graph, click Filters. Then click + Add a Filter.
- Click Select a provider, then select GCP.
- Click New Rule, then select Category.
- Click Select a Service, then type to select "Vertex AI."
- Click Select a Category, type "Gemini" and select the first option that shows up. Then, click the + button and select the remaining services with Gemini in the name until none are left.
Next, on the same filters menu, add the Gemini API services, and save your report for further use.
- On the bottom of the Filters menu, click Add a Filter
- Click Select a provider, then select GCP.
- Click New Rule, then select Category.
- Click Select a Service, then type to select "Gemini API."
- Click Select a Category, type "Gemini" and select the first option that shows up. Then, click the + button and select the remaining services with Gemini in the name until none are left.
- From the top right of the graph, click Save As New to create a new Cost Report with your changes.
- Enter a name, then click Save.
The view will encompass all Gemini costs, whether through Google AI Studio or Google Cloud Vertex AI and will look something like this:
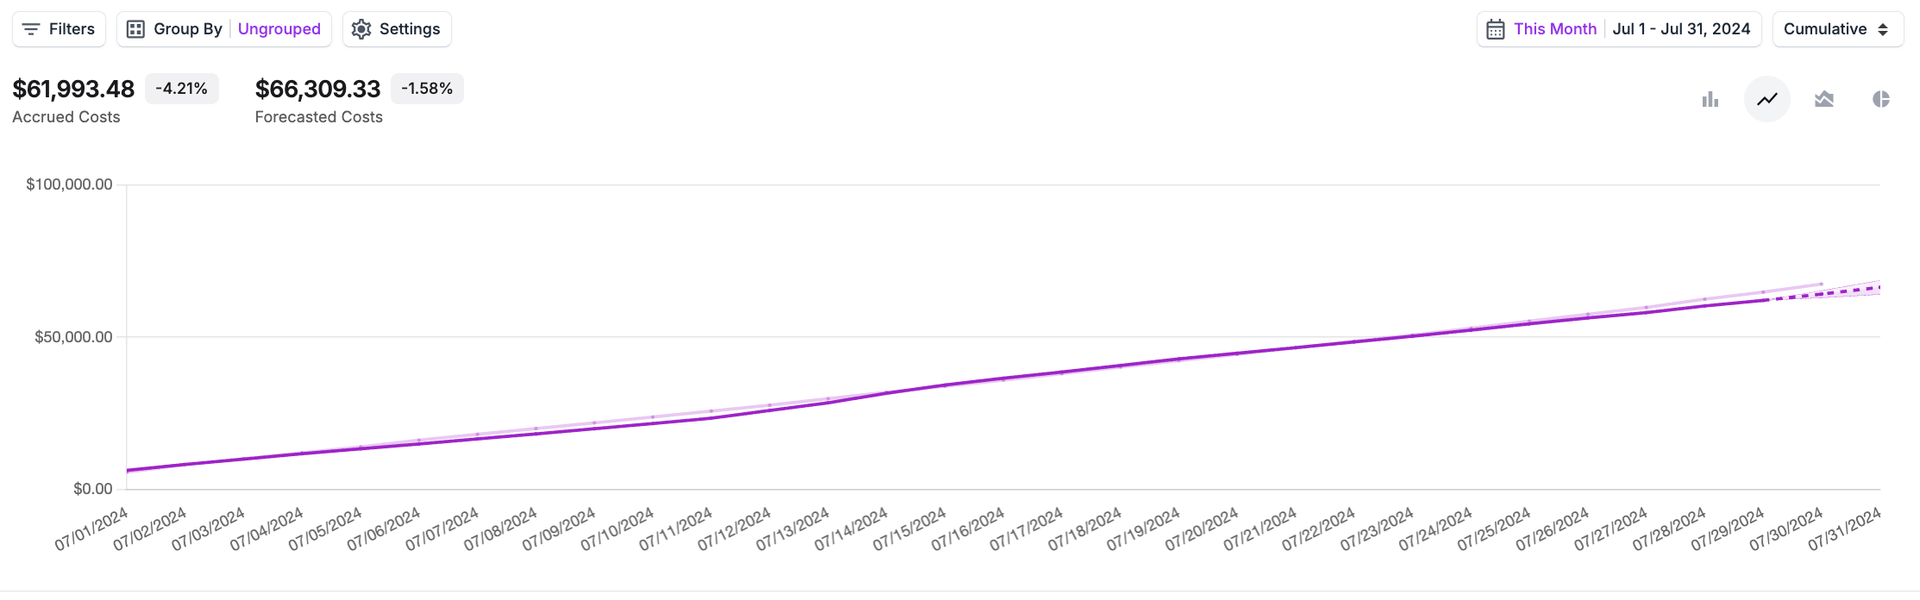
Total Gemini costs in Vantage
Note—With additional filtering, you can get an even more complete view of your AI costs. For example, you can add additional Vertex AI services, such as PaLM or training costs to view alongside your Gemini costs. Also, if you have a multi-cloud strategy and are using models from AWS Bedrock or Azure OpenAI, you can add them to the Cost Report as well. See how to view AWS Bedrock costs in Vantage here.
Now that your Cost Report is saved you can filter and group to better allocate and understand your costs. See the next section for examples and instructions.
See Gemini Costs by Model, Operation, Team, etc.
Grouping and filtering by costs in your saved Cost Report can provide help identifying cost drivers and in turn help with troubleshooting and optimization efforts. To group by costs in Vantage, click Group By in the top left, then select what you would like to group by. You can also filter by these categories by adding a new rule within the Filters menu.
See Gemini Costs by Team and Environment
To view costs for a specific team and environment, add a filter by account:
- Reopen the Filters menu. Then click New Rule and select Account.
- Click Select an Account, then type/select the team name, for example, "Messaging Production."
You'll now see costs specifically for that team and environment.
See Gemini Costs by Model and Operation
To view costs by model and operation, simply click Group by and select Category. This will show accrued costs by Gemini model (e.g., Gemini 1.5), along with operation (e.g., text output, input tokens, image input). Optionally, adjust the view of the costs for better visualization. For example, view costs as a pie chart by clicking the pie chart icon in the top right.
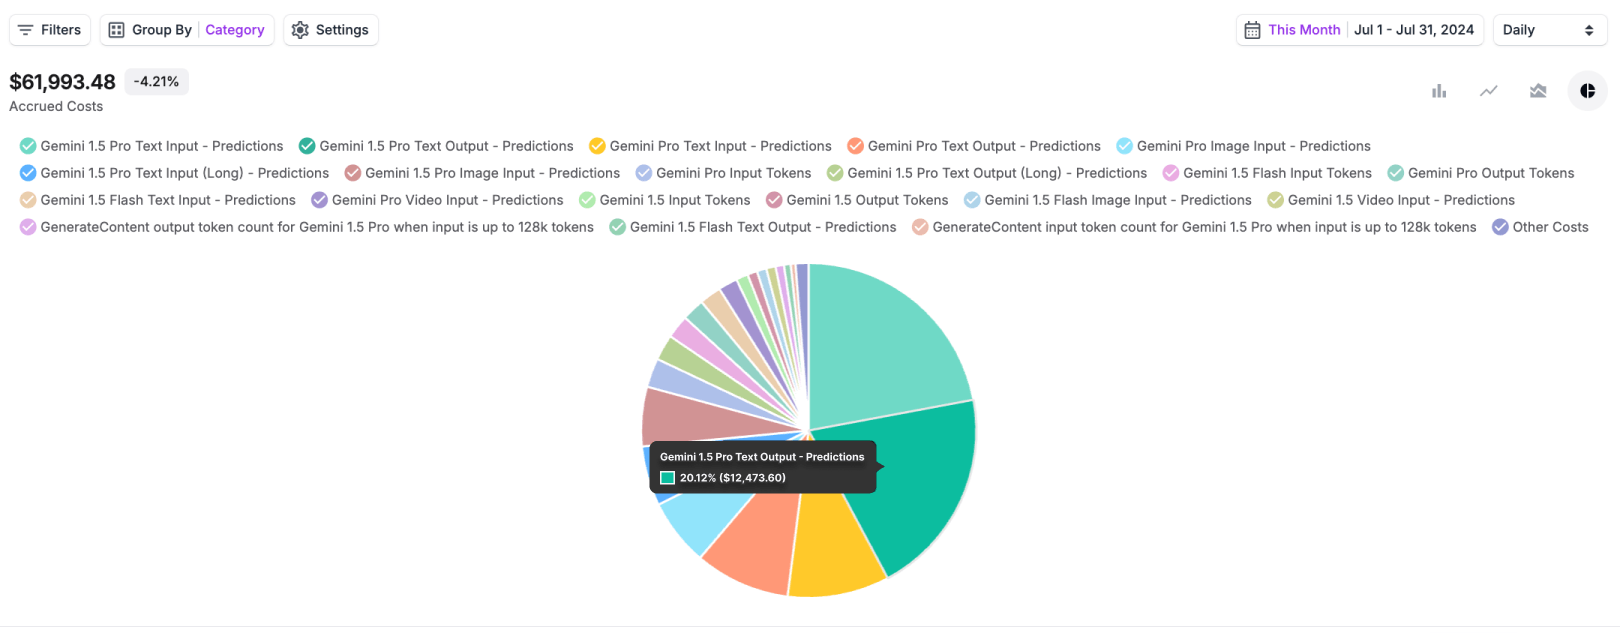
Gemini costs by model and operation in Vantage
Use Tags to See Gemini Costs
For even further granularity, use tags to group and filter costs by additional criteria. For example, application, feature name, or customer segment. You can even create virtual tags within Vantage, without engineering involvement.
Conclusion
While Google provides tools to monitor expenses, they often fall short of providing the necessary consolidated view and granularity. Vantage offers a comprehensive solution by providing a unified platform to visualize, analyze, and optimize Gemini API costs. By breaking down expenses by model, operation, team, and other dimensions, businesses can make data-driven decisions to maximize ROI and minimize spending.
Sign up for a free trial.
Get started with tracking your cloud costs.