How to View Amazon Bedrock Costs
See Amazon Bedrock costs in Vantage. Filter and group by team, model, project, and more.
By using Vantage to view your Amazon Bedrock Costs, you can group and filter costs as granular as your use case requires, enabling you to optimize your spend, identify cost-saving opportunities, and make data-driven decisions regarding usage.
Prerequisites to View Amazon Bedrock Costs
Vantage is a cloud cost visibility and optimization platform that makes it easy for you to view your cloud costs, as granular as your use case requires. With Vantage, you can see costs from 14+ providers, including AWS, and from there you can filter to view your Amazon Bedrock charges. To get started, you'll need to have or set up:
- A Vantage account.
- An AWS integration.
Note—getting set up is simple and only takes a few minutes.
See All Amazon Bedrock Costs
Once you're logged in, you can create a Cost Report to see your total Bedrock costs by following these steps:
- From the top navigation, click Cost Reporting.
- On the top right, click + New. A new, unfiltered Cost Report is displayed with your month-to-date costs.
- From the top left of the graph, click Filters. Then click + Add a Filter.
- Click Select a provider, then select AWS.
- Click New Rule, then select Service.
- Click Select a Service, type "Bedrock" and select the option that shows up. Note—if more than one service shows up for Bedrock (e.g. Claude (Amazon Bedrock Edition)), click the plus arrow and select the remaining services with Bedrock in the name until none are left.
- From the top right of the graph, click Save As New to create a new Cost Report with your changes.
- Enter a name, then click Save.
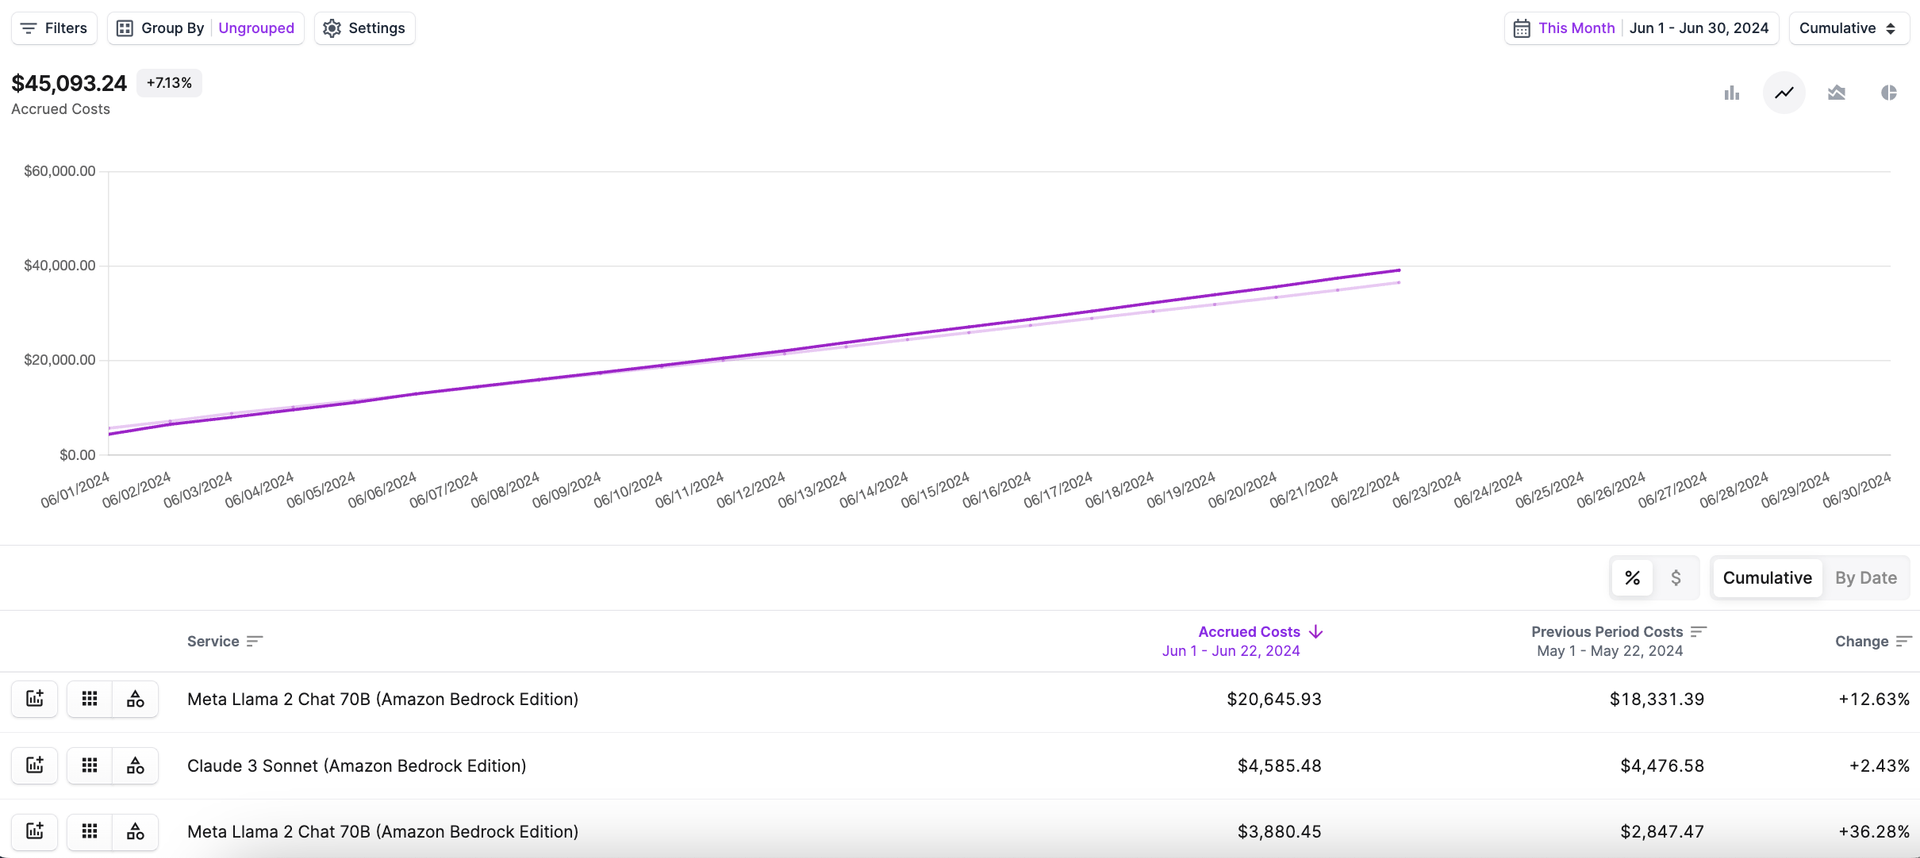
The view will encompass all Bedrock costs and will look something like this:
Now that your Cost Report is saved you can group to better allocate and understand your costs. See the next section for examples and instructions.
Amazon Bedrock Costs with Terraform
You also create this view using the Vantage Terraform provider with the below script. For an introduction to Vantage Terraform, follow this tutorial.
Terraform script to see Amazon Bedrock costs
Note—The filter local variable uses Vantage Query Language(VQL) to specify each model in the report. Update the filter local variable with the models you want to see.
See Amazon Bedrock Costs by Model, Operation, Team, etc.
Having a view of total costs is helpful for things like overall impact and budgeting, but to really understand and action upon them, you'll need to see these costs broken up into smaller increments. Once you have your Cost Report with all costs saved, you can follow the instructions below for some examples of ways to group costs.
Note—to group by costs in Vantage, click Group By in the top left, then select what you would like to group by. You can also filter by these categories by adding a new rule within the Filters menu.
See Amazon Bedrock Costs by Team and Environment
To view costs for a specific team and environment, add a filter by account:
- Reopen the Filters menu. Then click New Rule and select Account.
- Click Select an Account then type/select the team name, for example, "Messaging Production."
You'll now see costs specifically for that team and environment.
See Amazon Bedrock Costs by Model
For insights on spend per model, simply click Group by and select Resource. You'll see a list of models, complete with the version number, and the accrued costs. Optionally, adjust the view of the costs for better visualization. For example, view costs as a pie chart by clicking the pie chart icon in the top right.
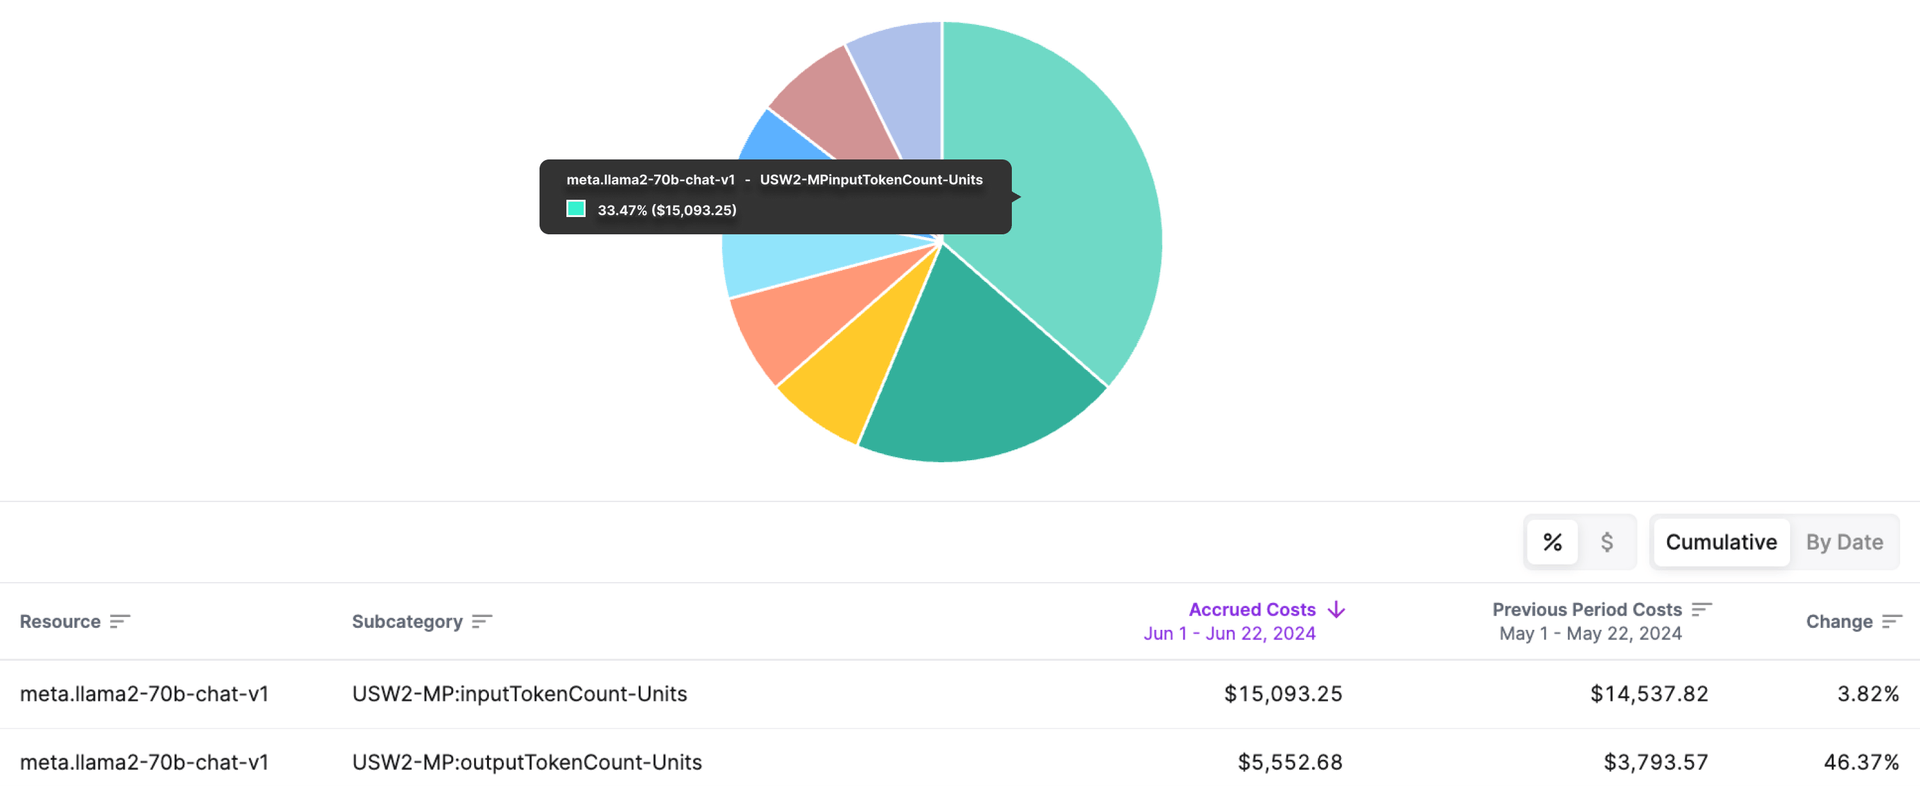
See Amazon Bedrock Costs by Operation (i.e., Input/Output Tokens)
Viewing costs by operation is useful for understanding how your usage is distributed. Keep the report grouped by resource, and add an additional grouping for Subcategory. Now, you can see costs further broken out by operation for each model.
Use Tags to See Amazon Bedrock Costs
For even further granularity, use tags to group and filter costs by additional criteria. For example, application, feature name, or customer segment. You can even create virtual tags within Vantage, without engineering involvement.
Conclusion
By breaking down costs by model, operation, team, and more, you gain insight into what is driving spend. This enables your company to make more informed decisions on AI initiatives, allocate costs accurately, and optimize spend. With these insights, you can maximize the value of your AI investments while maintaining cost efficiency.
Sign up for a free trial.
Get started with tracking your cloud costs.