clickhouse-local vs DuckDB on Two Billion Rows of Costs
clickhouse-local was faster than DuckDB for building the Q1 2023 Cloud Cost Report, but its UX left something to be desired.
For querying over two billion rows of cloud infrastructure spending data, we found clickhouse-local to be 3X faster than DuckDB. But each tool is not made for exactly the same purpose, and developer experience remains important.
Intro and Background
Each quarter we analyze billions of anonymized and aggregated rows of billing data to report on cloud spending trends. For example, for the first three months of 2023, we ranked the top 10 services across AWS, Google Cloud, and Azure by spend:
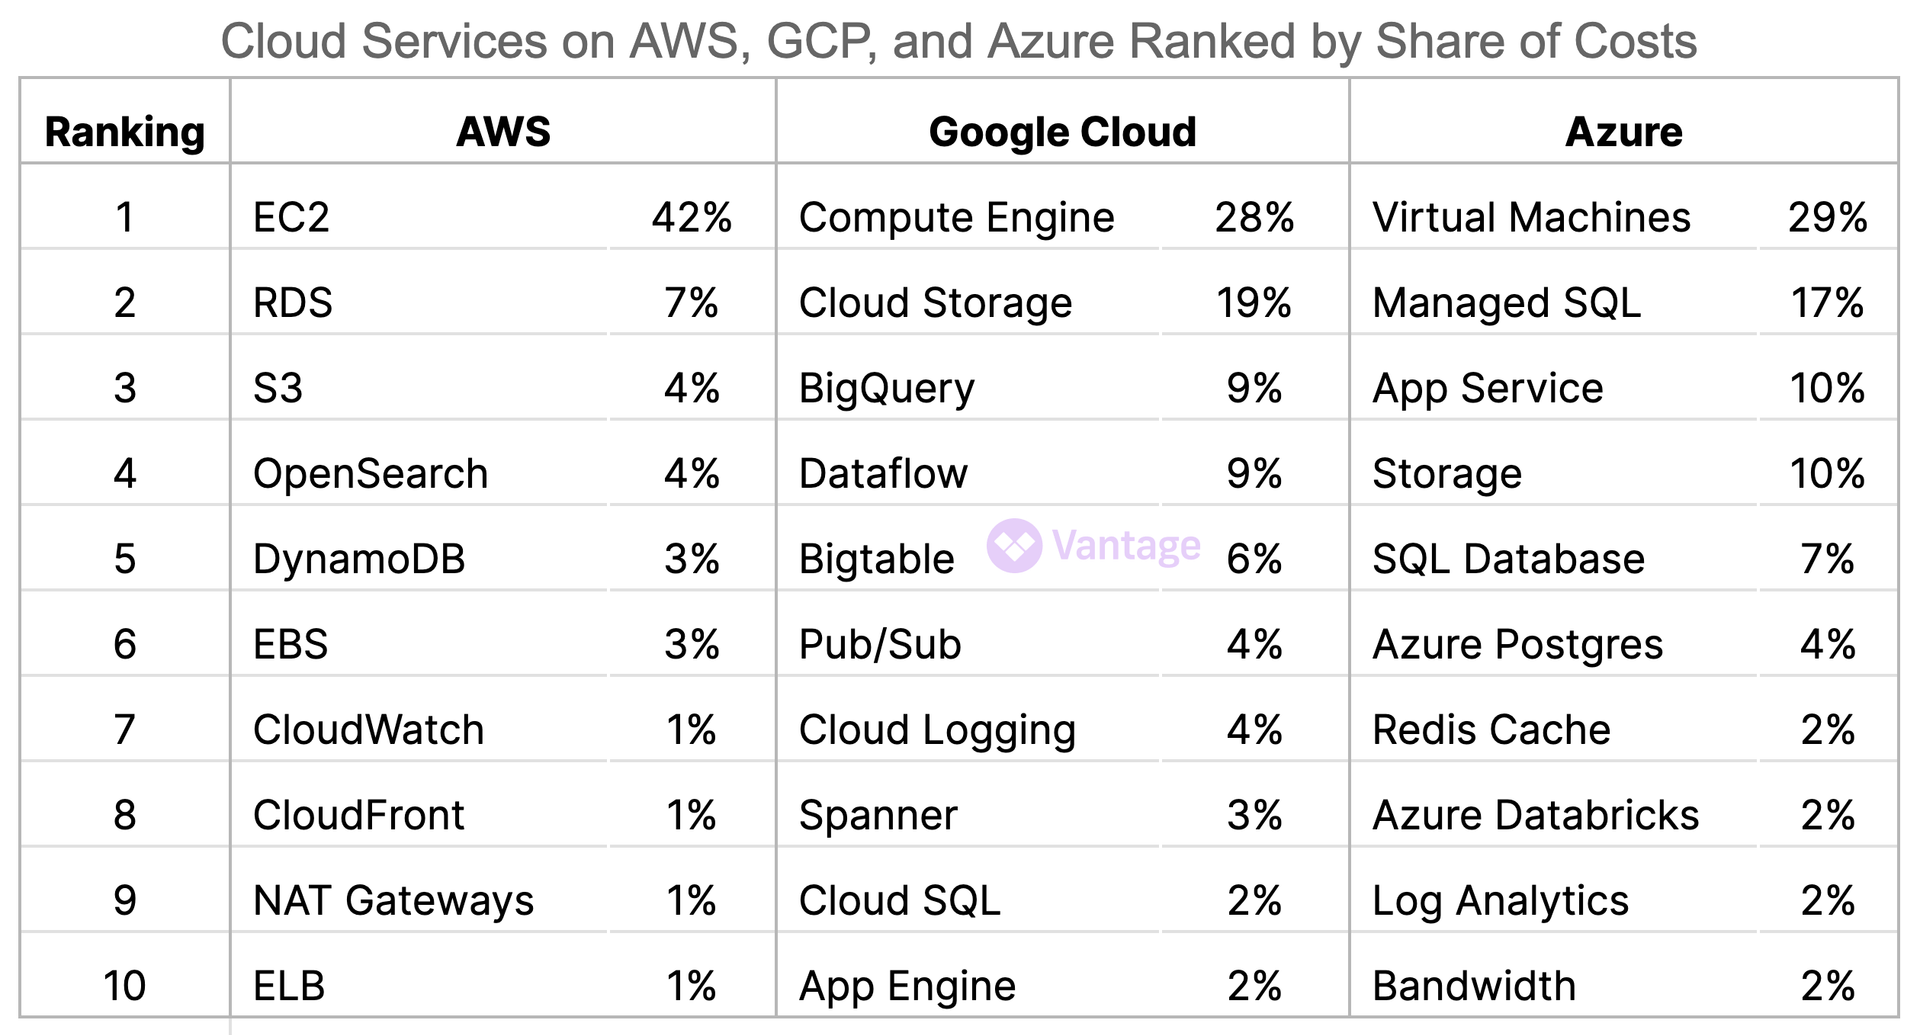
Source: Cloud Cost Report
To perform this analysis we export an anonymized sample of data from our warehouse to a 16 GB Macbook Pro and go to work. Typically, we give ourselves only a few days to report on longer-term trends as well as find new insights in the data.
At first, we used a local Postgres server but found it to be painfully slow, especially for exploring the data and testing out hypotheses. Last quarter we switched to DuckDB and it's speed and UX was a revelation.
By the time of the Q1 report we had migrated our main Data Warehouse to ClickHouse and decided to give clickhouse-local a try. It turned out to be 3X faster than DuckDB for raw query speed, although its runtime model made it trickier to work with.
Query Performance (Reads)
To start with the "hello world" of SQL, we count all the rows. DuckDB is blazing fast:
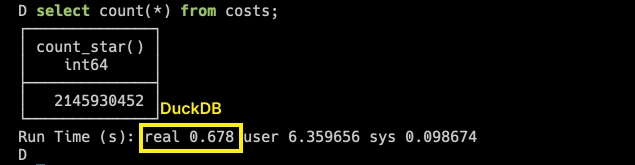
Time for SELECT COUNT(*) in DuckDB
But clickhouse-local is instant to the point where it seems this value is must be written in the table metadata.

Time for SELECT COUNT(*) in clickhouse-local
Moving along from that, let's try a real query. The graph below is the share of on-demand compute usage versus committed-use usage (Savings Plans, RIs, and other discounts) for the last three quarters.
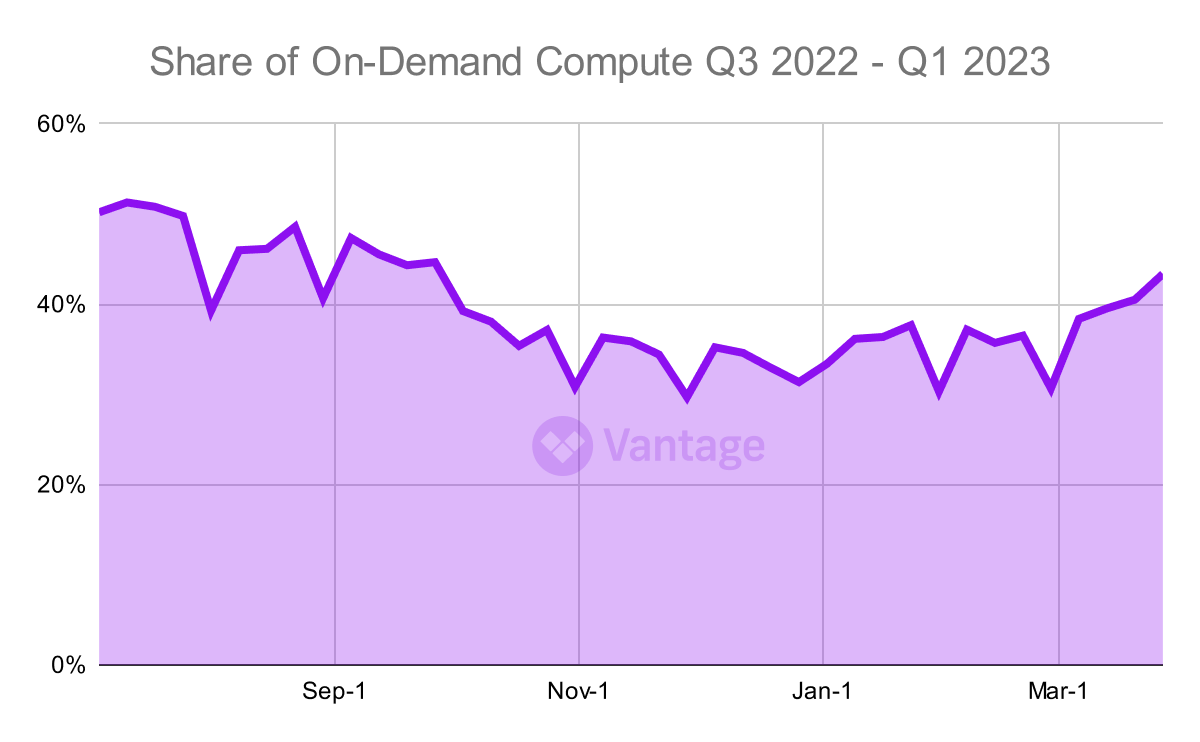
Percentage of on-demand compute usage for Q3 2022 - Q1 2023. Source: Cloud Cost Report
DuckDB takes roughly 30 seconds to compute the data points in this graph, where each week of the quarter has a value that is aggregated over all EC2 compute usage.

Time for a more complex read-only query in DuckDB
clickhouse-local is 3X faster, returning the same result in 11 seconds - processing nearly 200 million rows a second!
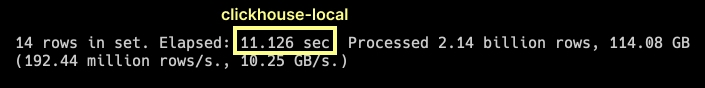
Time for a more complex read-only query in clickhouse-local
Query Performance (Writes)
We would expect reads to be very speedy in a column-store database. But there are numerous architectural options for writes - has ClickHouse sacrificed in this area? To find out, we profiled a second of the queries we use. This one creates an intermediate table of all the costs of all the instance types which makes analysis and grouping easier to create the graph below.
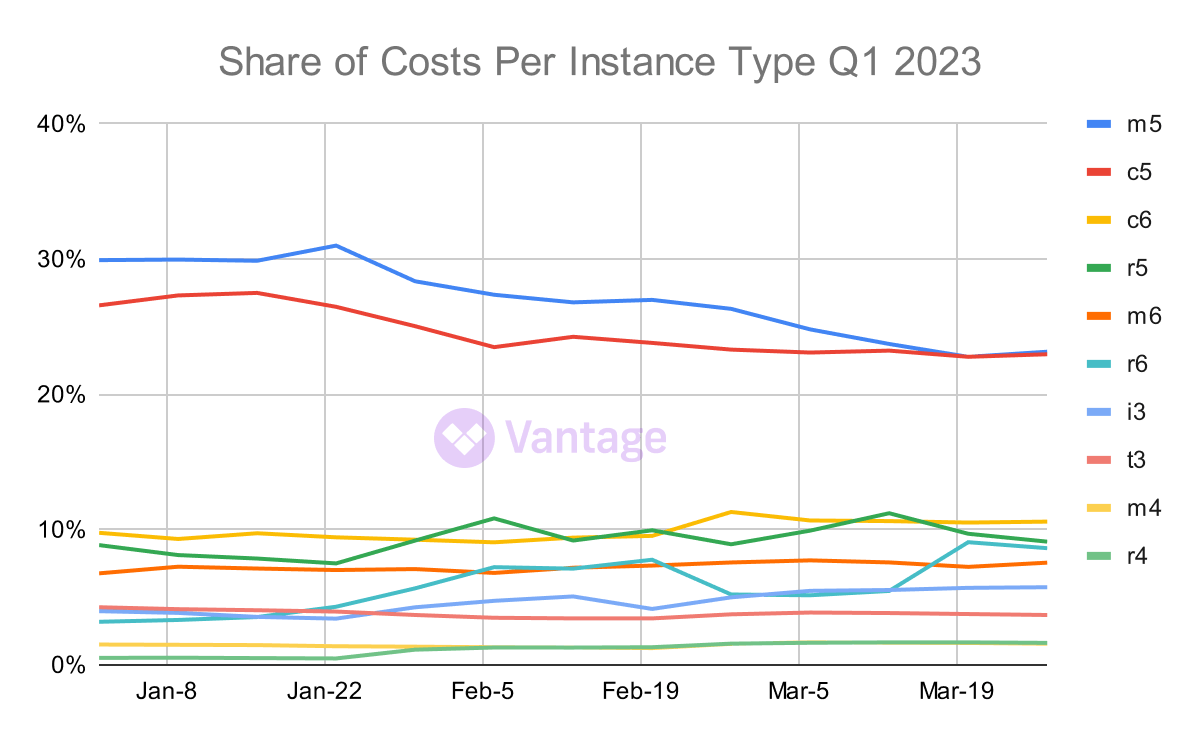
Ranking of the popularity of EC2 instance types throughout the quarter by share of costs. Source: Cloud Cost Report
For this query we see the same performance difference as above. DuckDB takes just under 3 minutes to write the table:
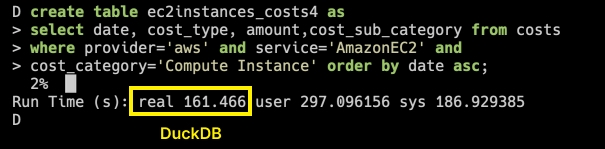
Time to write an intermediate table in DuckDB
ClickHouse creates the table 3X faster, needing under a minute to write the data.
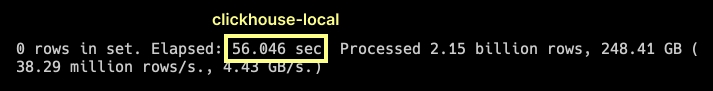
Time to write an intermediate table in clickhouse-local
Savvy ClickHouse users would know that this might not be a fair test. clickhouse-local may have written the table to memory and not to disk. This operation speaks to a core difference between the two tools.
Memory and Disk Considerations
In our previous post talking about DuckDB, we received some feedback that Postgres vs. DuckDB is not a fair fight. Noted! Here we are comparing two column-store databases.
Our setup for this (light) comparison was a 16 GB Macbook Pro and a little over 2 billion rows delivered as gzipped CSVs. For DuckDB, we loaded the files directly into the database with COPY costs FROM 'q3-2022/dump20002_part_00.csv' (AUTO_DETECT TRUE);. For clickhouse-local, we opted to convert them to a parquet file but later found that it is possible to concatenate all those files together. The typical mode of operation with clickhouse-local is to query the files directly, but in that situation ClickHouse notes that most of the query time is spent loading the data from the file.
For improved performance, load the data first and then run each query.
Instead, we loaded the data into a ClickHouse table the same way we did for DuckDB and then ran our queries. Note that we did not employ any primary keys or indexes on either table. Both tools correctly interpreted the data types of each column.
clickhouse-local Drawbacks
In short, clickhouse-local feels like a more full featured database while DuckDB feels like a local tool. The major sticking point is saving tables locally. For this type of analysis it’s helpful to have costs.db on disk over multiple sessions. Even when resuming writing queries, the SQL history is preserved. Contrast that with what is required to preserve the working table or result set in clickhouse-local:
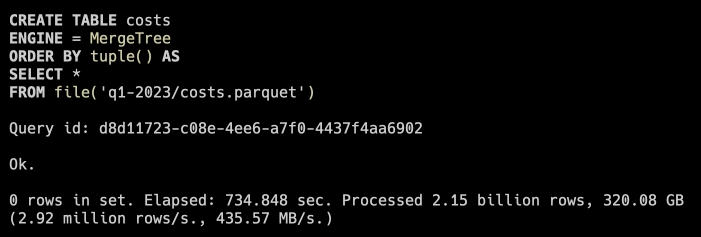
Writing the results of a clickhouse-local query to disk
In the screenshot in the section above, loading data from disk took 734 seconds (12 mins). Doing that on each session to achieve a 3X query speedup is not practical. An interesting new project, chdb seeks to address this use case. Of course, it's also not that hard to run a full ClickHouse server and client locally with ./clickhouse server and ./clickhouse client.
What if the scale of our report was larger? What if it contained 50 graphs needed to be regenerated frequently? In that case we might consider an ETL process which uses a shell script to take data from our main warehouse (which is ClickHouse!), run each query on a containerized worker (clickhouse-local is a single binary like DuckDB), plot each result set into an SVG, and write the images to a data store to be displayed on a webpage or formatted into a PDF. That’s some nice data engineering.
ClickHouse in Your Lap(top)
We saw a significant speedup in query performance with clickhouse-local as compared to DuckDB on the same data. DuckDB has a nice developer experience but on this size of data speed is king. Regardless, the emergence of both technologies in the past year is a boon to data wranglers everywhere. The clickhouse-local Show HN was only in January! AI is not the only space that is rapidly innovating.
Sign up for a free trial.
Get started with tracking your cloud costs.