Design Considerations for Your Billing API
What to expect when publishing an external billing API for customers.

There comes a time in every usage-based SaaS company’s life when it’s necessary to expose a billing API for customers to download their costs. Internal reporting, automated finance workflows, and data archiving are all reasons a (usually large) customer might need this.
But this seemingly simple problem ends up being a rat’s nest of obscure issues. After building billing integrations with a dozen cloud service providers we've picked up on some pitfalls and best practices for developers interested in creating a /billing endpoint.
Comparing Cloud Service Billing APIs
Suffice it to say, everyone does it differently. The table below shows 10 cloud providers and how they expose billing data. For each provider, Data Sync indicates how fresh the billing data can be. Schema Details shows what granularity of information is available. Integration is the method to access the data.
Comparing how popular cloud services give customers access to billing data.
AWS has set a standard for a relational schema that exposes billing data. Unfortunately AWS Cost and Usage Reports (CUR) are complex and clunky CSVs that are dumped into S3 buckets requiring regular downloads and data refreshes. The volume of potential billing data can also be very large, measuring in the GBs per file.
Azure provides a nice REST API which has up-to-date data when queried.
Behind Azure's API, however, is decades of different organizational structures for paying Microsoft such as Pay-as-you-go versus Enterprise Agreement. We have also run into the occasional issue with filtering down the amount of data returned.
If AWS is antiquated but functional and Azure is easy, Google Cloud is onerous.
Google Cloud uses a relatively complex system involving BigQuery exports for billing data.
GCP includes dozens of steps for a completely new account. And trust us, we were motivated to streamline the setup process as much as possible! Even after a BigQuery dataset has been created, the data can take up to 48 hours to fully propagate for previous months.
Which combination of data syncing, granularity, and integration method is right for your company? That depends on what service you offer and how you charge. Unfortunately billing gets complicated real fast.
Challenges with Billing Data
Billing data is not quite financial data and not quite engineering metrics. Unlike many systems of record, billing data is not append-only. A lot of providers overwrite existing data, and data can take days to "cure" and be considered canon. Typically bills are also finalized at the end of the month.
Cardinality
Cardinality refers to the number of dimensions present in the data which maps to compute, storage, and bandwidth costs to process the data. To keep cardinality and complexity low, billing data is often aggregated to a higher level of granularity, similar to how observability solutions operate.
Upfront Commitments
Does your service allow for customers to make upfront commitments based on their usage? This may have to be handled in the billing export so customers can answer questions like "are we hitting our commitment for this month?"
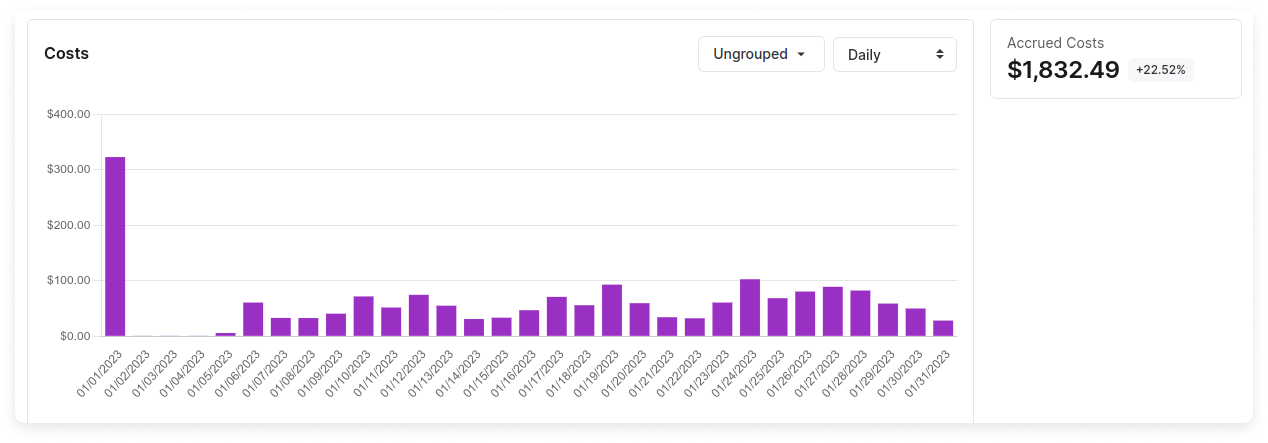
Datadog monthly commitments showing up as a spike on a Cost Report.
If the billing data shows a spike of usage on the first of the month representing the discount, then when the customer downloads the data it will appear to them as if they have been incorrectly charged. Amortizing these types of commitments is a core feature that of cloud cost management platforms.
Credits
There may be credits or a credit system which applies to the customer's bill. Customers often have tto meet their minimum credit quotas or lose them every month.
New Relic offers 100 GB of free data ingestion per month to their customers.
Discounts
For customers with predictable workloads, bulk discounts are a very useful tool for sales teams. How these discounts show up in the billing data can be tricky. Most end users who are tracking billing for their companies want to see month-to-date data inclusive of committed use discounts. This means that billing data on the 15th of the month should roughly reflect half of the expected charges.
Implementation Considerations
Having a good grasp on the billing data model for your service means you are ready to tackle the implementation of the billing endpoint. How your customers authenticate to this endpoint, how much data they can download, which columns are available, and which filters they set dictate the developer experience for handling billing data.
Authentication
There is basically no reason to allow for writes to /billing. For this reason, ideally your API would allow for the creation of read-only tokens. OAuth scopes would be another solution.
Fastly allows users to create a read-only token to access billing data.
Data Size
Depending on the scope of services that you offer and the granularity of usage tracked, you may decide that API access is not the right way for third parties to download data. If you offer things like per second billing and serve customers spending millions of dollars a month, the infrastructure requirements to support a real-time API are more intense.
Datadog makes data available in near real time but with rate limiting on API requests.
If you have a lot of SKUs or high granularity of data, there are real downsides to this approach, namely that downloading bulk data (e.g. the last 6 months of usage) takes painfully long. Instead, you can decide to make billing data available once per day.
Databricks delivers billing data as CSV files to S3 buckets on AWS. On Azure, Databricks costs are available via the Azure REST API.
Billing Schema
Billing data has interesting properties. Each day reflects the month-to-date costs accrued in the account so far. At the end of the month, these costs reset.
AWS cost and usage reports require comparing 2 CSVs to understand the costs for a week or a day.
Some common tables or objects we would expect to see in a billing data export are:
- Account Information: This includes the user's account ID, name, and any other relevant information. This can be helpful as usage data is tied to different accounts to determine what's causing an increase in costs.
- Usage Information: For example the number of requests made, the amount of data transferred, etc.
AWS CUR files have a lineItem table contains dozens of columns which may or may not be filled in.
- Price Information: Most services will have custom rates, commitments, discounts or other items which cause there to be a price that is different than the publicly listed price.
User Defined Filters
Filtering capabilities are great for you and for end users because it limits the amount of data that needs to be transferred and reduces the load on the system. Ultimately customers want to be able to analyze their usage and being able to delineate usage based on organization, account, or user is table-stakes.
Client Access and SDKs
The last consideration is how your customers and third-parties like Vantage will access this information. Three real examples from MongoDB, Snowflake, and AWS show the varying methods of client side access.
MongoDB billing data is available via a REST API.
Ruby code to make requests to MongoDB's /invoices endpoint.
If you are a cloud infrastructure provider you may be tempted to expose billing data through your own system.
Snowflake billing data is available in a Snowflake table.
If the billing data is available in a table SQL may be required. The query below is the beginning of the SQL needed to determine cost per query in Snowflake.
Writing a SQL query to access billing data in Snowflake.
To get an idea of what an end-state client could look like for your billing API, consider the extensive documentation of the Cost Explorer API in Boto3.
Conclusion: Building Billing
Having gone through all of this, it might seem like adding the /billing endpoint can wait another quarter. But the benefits of transparent access to billing data ultimately make usage based services more attractive to large customers. As the finance and engineering worlds move closer together in the cloud, programmatic access to billing, usage, and costs will become standard.
Sign up for a free trial.
Get started with tracking your cloud costs.