Understanding the CUR Schema and File
Cost and Usage reports provide the most detailed billing data available on AWS.
If you have found this blog post you have stumbled upon the bowels of AWS billing, a place where the complexity and variety of options is the whole reason Vantage exists. Welcome to Cost and Usage Reports (CUR), the raw firehose of billing data which provides the most detail about service cost and consumption on AWS, with files that grow to 10s or 100s of gigabytes.
To work with CUR data you will need to understand its schema, or data dictionary, which spans 10 tables and hundreds of columns. Fortunately for most billing cases, only these tables will be relevant.
Columns from the following tables are only populated if there is data, for example by buying a Reserved Instance or tagging resources.
Cost and usage reports must be enabled first, and then there are several methods to parse them. The identity, bill, and lineItem schemas are a good foundation for working with the other tables if needed. Finally, it is possible to write SQL against CUR data. For more questions about developing against CUR, ask us in Slack.
Enable and Download CUR
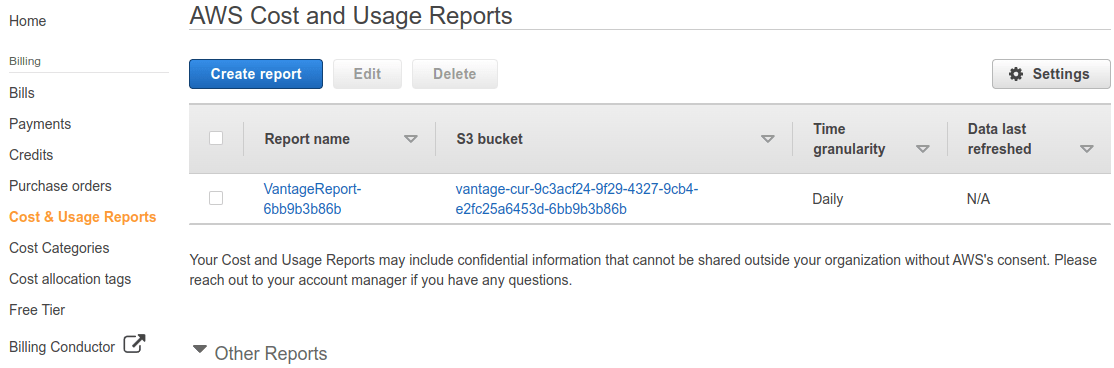
A brand new cost and usage report configured in the billing console.
To enable CUR, head to the AWS billing console. You will need to have an S3 bucket setup first to be the report destination and have Cost Explorer itself turned on. For Vantage users, these resources are created upon connection.
It can initially take up to 24 hours for the first reports to generate, but after this AWS will deliver the reports daily. The data is not finalized until the end of the month, where discounts or support amounts will be applied. There are also some particulars around how reports create multiple files, size limits, enabling additional things like Resource IDs, and more in the AWS docs on CUR.
Parsing Cost and Usage Reports
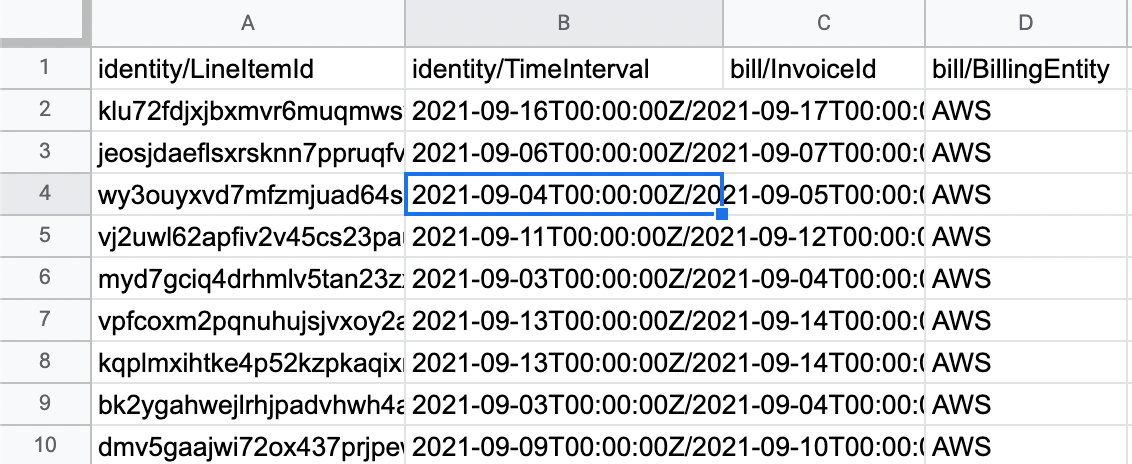
A snippet of a cost and usage report showing columns from the identity and bill tables.
CUR data comes as a CSV file as shown above and can therefore be opened in Excel or Google Sheets, and easily parsed with a CSV library from any programming language. Of course just having this data is not very useful. It needs to be deconstructed to pull out useful cost data.
At the end of this article we cover various data destinations like Redshift and Quicksight, but CUR data can be queried programmatically from boto3. Again, this capability is only useful if you understand the CUR schema.
Using boto3 to get cost and usage data from the Cost Explorer API. Full code.
The Cost and Usage Report (CUR) Schema
The identity , bill , and lineItem tables will always have data. Identity is a metadata table, Billing deals with the actual billing period, entity, and type (e.g. Amazon refunded Account for Month), and finally the Line item table contains all the actual cost and usage data. Most likely you will have some data in the product and pricing columns unless you are fully on the free tier, using only spot instances, making only Marketplace purchases, or other edge cases. With a mix of services, inspecting the product and pricing tables will give you up-to-date information on the list prices and product configurations of the services in your account.
The other five tables will be populated if you are using savings plans or reserved instances, cost categories, or tags. In fact, CUR is most useful for understanding the impact that discounts are having, and where there may be additional opportunities for savings. Data for Autopilot comes from CUR, for example.
For the tables below, note that the column header in the CUR csv is tableName/ColumnName, for example lineItem/BlendedCost.
identity Table
The usefulness of these columns comes from the fact that a single CUR report may be split over multiple files, especially if Resource IDs are enabled. In that case, the LineItemId will be the same across those files for the same resource.
bill Table
The biggest thing to be aware of with the bill table is that CUR data is not considered “finalized” until after the end of the billing period. AWS applies refunds and some discounts at the end of the month, before it actually invoices the account. In this table, you can check for this by determining if the invoiceID is blank. Using the Cost Explorer API, check for the estimate parameter to be set to False for the report to be finalized.
lineItem Table
Two concepts make or break this table. The first is Blended vs. NetUnblended vs. Unblended costs. Blended costs incorporate the average of on-demand and committed-use spend across accounts within organizations. Unblended costs are essentially the costs that show up on your bill. NetUnblended costs incorporate discounts. AWS recommends using UnblendedCosts, a “cash basis” of accounting for cloud computing, unless your organization has specialized needs.
ProductCode, UsageType, Operation are the other set of columns to focus on. Between them it is possible to get very granular on costs. Make sure to GROUP BY in SQL on these and use aggregates.
Transforming CUR for Cost Visibility
There are many destinations for CUR which can help organize and make the data queryable. The cloud pricing API provides HTTP query params where you can manipulate data that has already been aggregated from CUR. The console provides filter sets, visualizations, and notifications in Slack based on CUR data.
Amazon also provides direct integrations to the following SQL services:
- Athena
- Quicksight
- Redshift
Each of these requires configuration but once they are up and running queries like the following can be written (source):
Totaling EC2 costs using the CUR schema.
As we saw in the lineItem section above, this query pulls from the ProductCode and UnblendedCost columns to sum the cost of EC2 for the time period covered in the report. Note that it excludes taxes, refunds, and credits.
Conclusion
This post is an introduction to the world of cost and usage reports, an area of AWS that we have been developing against for years. Whether you write your own programs, pipe CUR into cost visibility tools, or build SQL queries, the breadth and depth of the data Amazon provides can be overwhelming. By understanding the basics of the CUR schema, you can zoom in on the columns you need quickly be successful developing with CUR.
Sign up for a free trial.
Get started with tracking your cloud costs.