Vantage Adds Saved Filters to Dashboards
Vantage adds saved filters to dashboards, enabling customers to view all reports on a dashboard with consistent filters applied.
Today, Vantage announces the addition of saved filters to dashboards. Customers can now add a saved filter to a dashboard, enabling them to view all Cost Reports on the dashboard with consistent filters applied.
Customers will often make high-level Cost Reports that contain all service costs for their connected providers. These reports can be easily viewed on a single dashboard. Previously, if a customer wanted to customize this type of dashboard for specific teams, they would need to duplicate the dashboard multiple times and add extra filters to each Cost Report to capture only that team’s costs. Now, customers can define filter criteria once using a saved filter, and apply it to a dashboard for streamlined reporting.
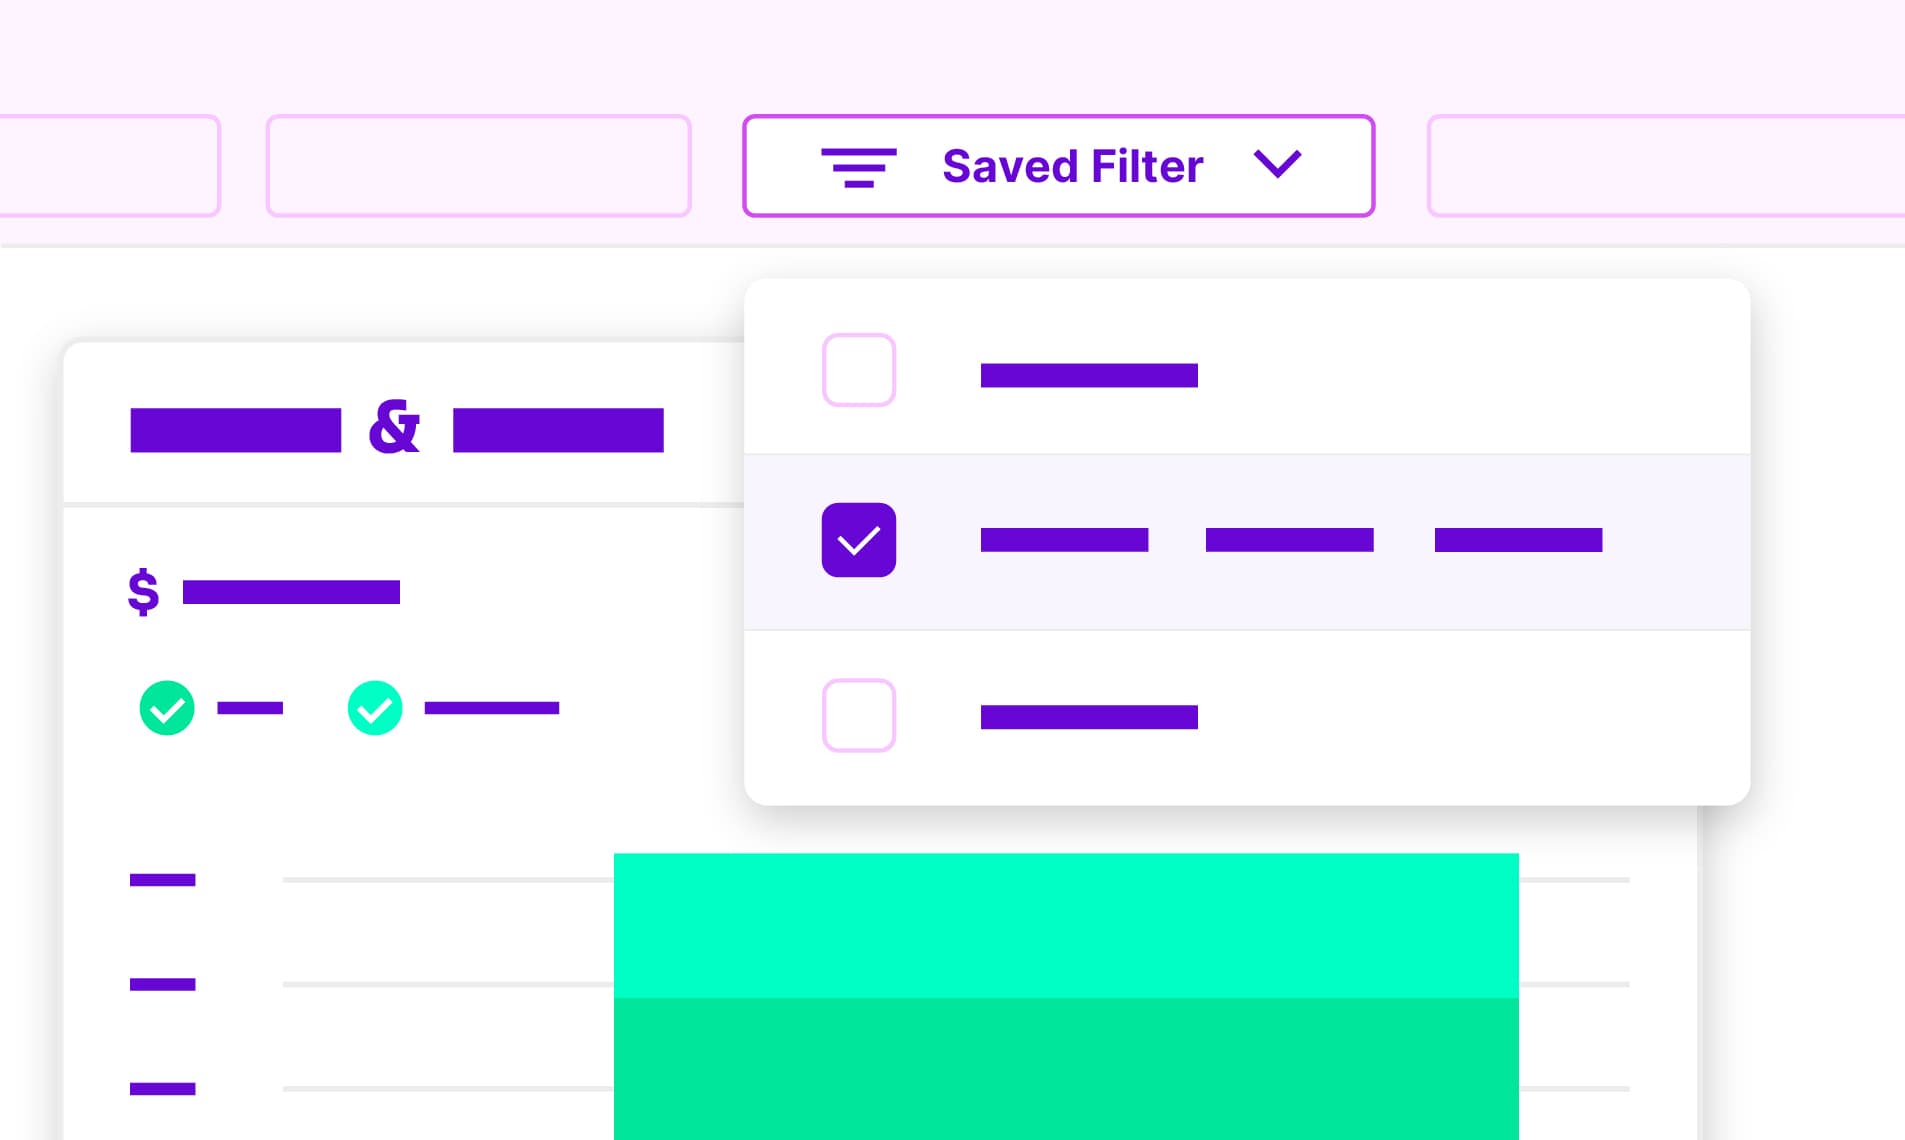
Adding a saved filter to a dashboard in the console
The feature is available to all customers. To get started, navigate to the Dashboards screen in the console. The Saved Filters dropdown menu is available at the top of any dashboard. See the documentation for more information on how to use dashboards.
Frequently Asked Questions
1. What is being launched today?
Today, Vantage is launching the ability to add saved filters to dashboards.
2. Who is the customer?
The customer is any Vantage user who wants to have the same filter logic applied to multiple reports on a dashboard.
3. How much does this feature cost?
There is no additional cost to using saved filters or dashboards.
4. What is a saved filter?
Saved filters allow customers to save and reuse filter logic across multiple Cost Reports. Saved filters can be applied to individual Cost Reports and now used on dashboards to apply to any Cost Report on the dashboard.
5. How many saved filters can I add to a dashboard?
You can add as many saved filters as you want to a dashboard.
6. What logic is used between existing filters on a Cost Report and the saved filter?
When you add a saved filter to a dashboard, if a preexisting filter on a Cost Report and the saved filter use the same provider (e.g., both use AWS), "AND" logic is used between each filter set (i.e., show costs where the preexisting filter AND saved filter are true). If the preexisting filter and saved filter use different providers, “OR” logic is used between each filter set.
7. Will saved filters apply to segment reports on dashboards?
At this time, saved filters only apply to Cost Reports; however, the ability to add saved filters to segment reports on a dashboard is on the roadmap.
8. Is this feature available in the API and Terraform?
Support for this feature will be available soon in the API and Terraform provider.
Sign up for a free trial.
Get started with tracking your cloud costs.

