FinOps as Code: Automating and Visualizing Unit Economics
Use FinOps as Code to create an automated pipeline and view business metrics along with cloud cost data.
Unit economics relates to analyzing the costs associated with producing or providing one unit of a product or service. The FinOps Foundation notes that unit economics "bridges the gap between what an organization spends on cloud and the fundamental value that cloud spending creates." Organizations in the cloud can track costs for metrics related to user base, transactions, or orders to help align cloud usage with business objectives.
The Scenario: How to Visualize Unit Economics
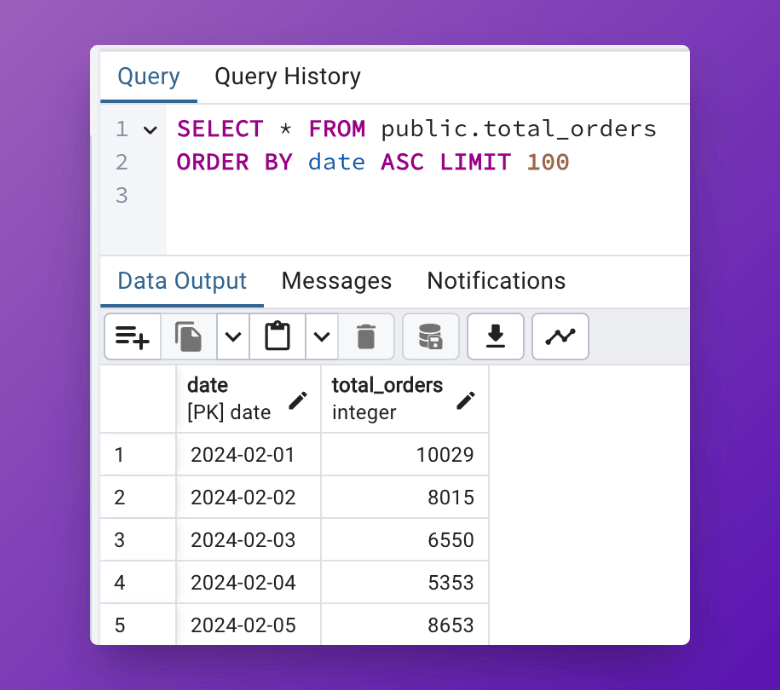
You work for an e-commerce company that wants to track certain business-related metrics along with their cloud infrastructure costs. You've observed that cloud costs for the e-commerce site typically surge during the week but drop on weekends. You want to view these metrics on top of your cloud costs to understand how your current cloud spending affects per unit costs. You have a view set up in a PostgreSQL database, called total_orders, that aggregates data from other tables, as seen in the image below.
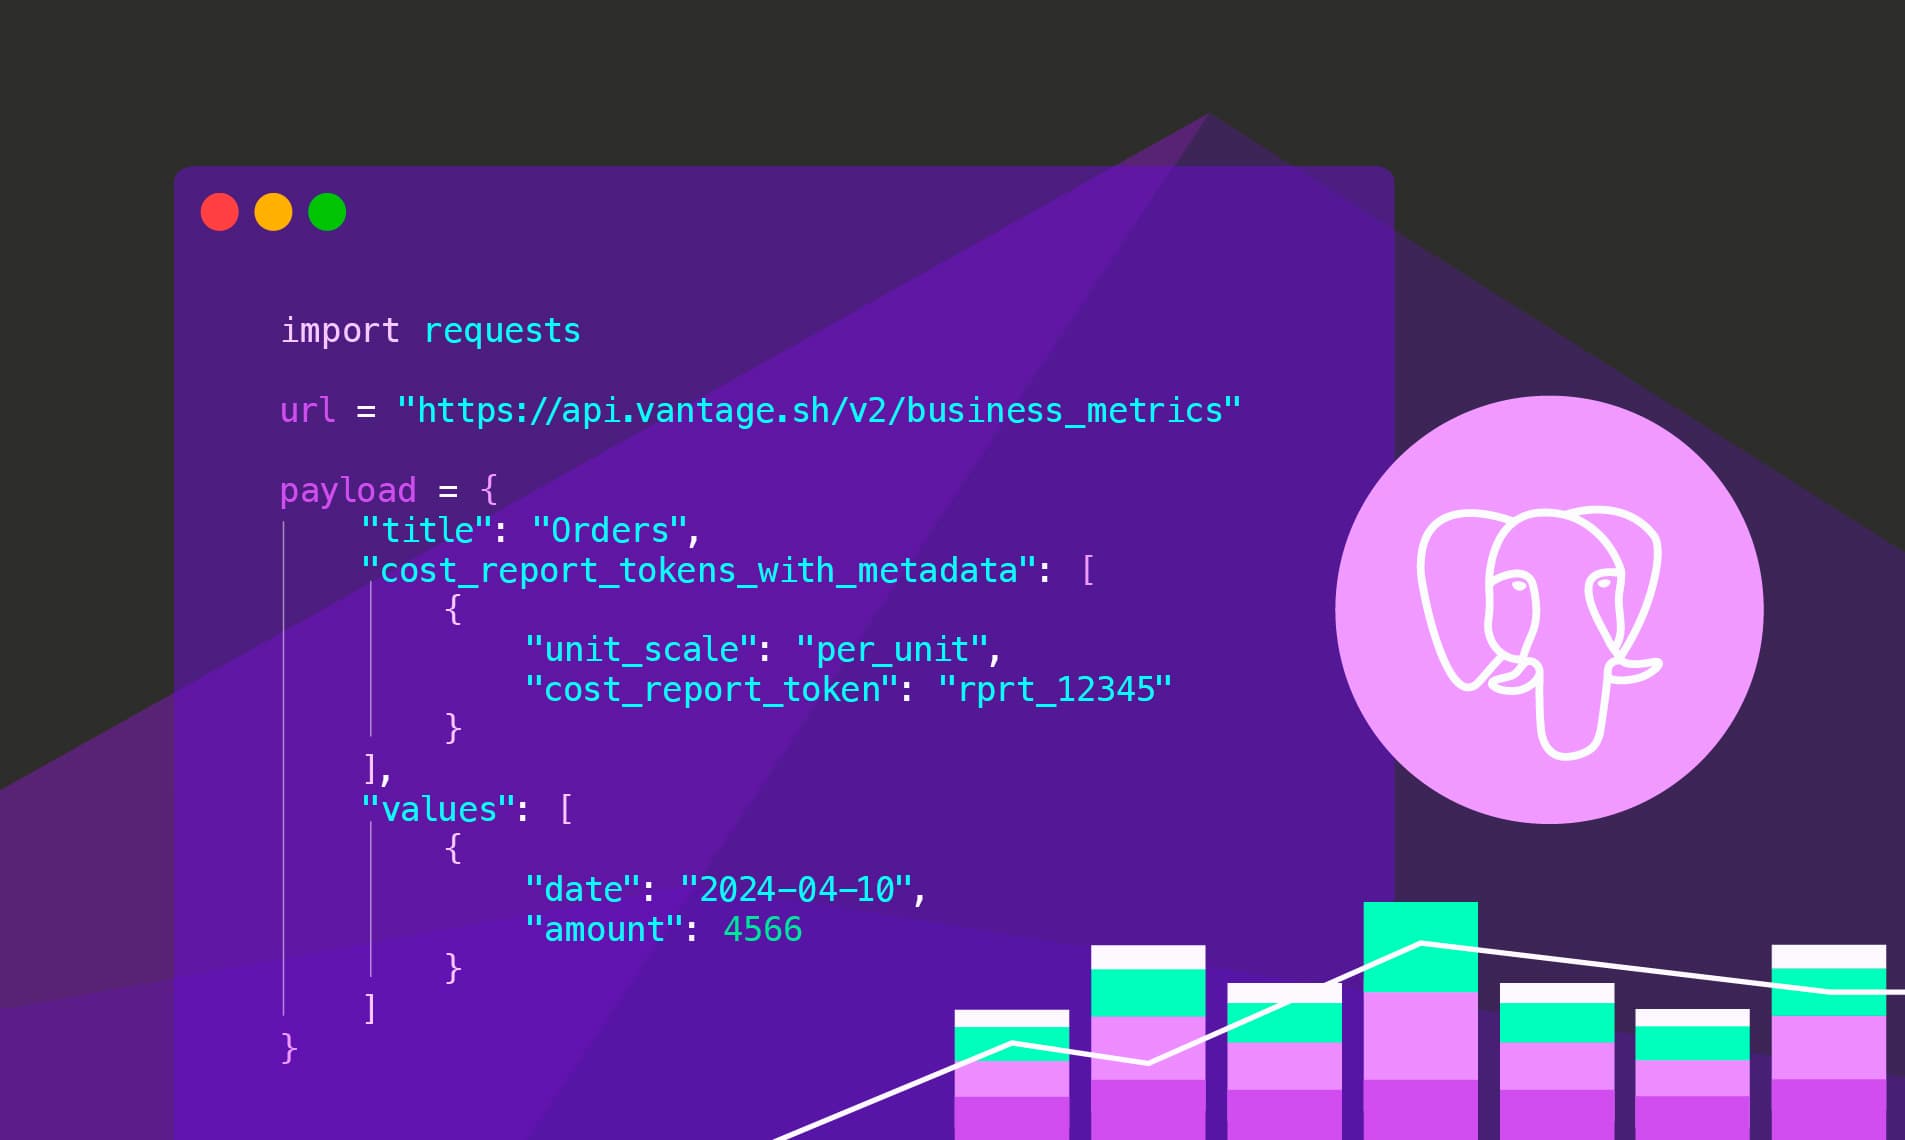
In this demo, you’ll create a script that queries this table and then uses the Vantage API to import the data as a business metric through a daily automation. You can use the per unit costs feature in Vantage to view business-specific metrics along with cloud costs on Cost Reports. The workflow for this automation follows the below diagram.
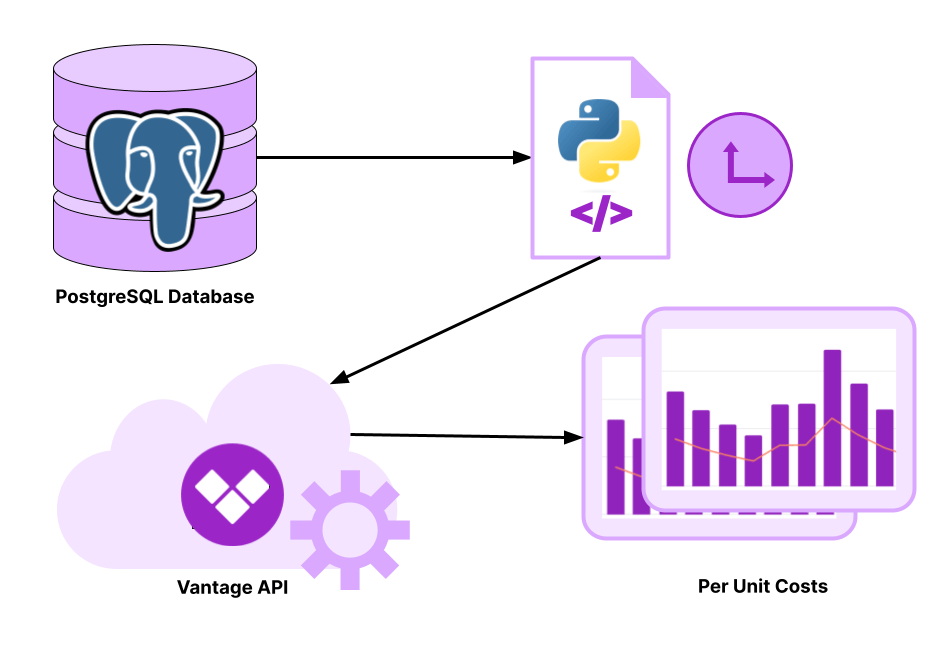
- A Python script is set to run daily and queries the PostgreSQL database to obtain data from the
total_ordersview. - The result is passed to the
/business_metricsendpoint of the Vantage API to update a business metric called Orders. - You can view the business metric and calculated per unit costs on a configured Cost Report in Vantage.
Prerequisites
This tutorial assumes you already know how to work with and configure SQL databases, particularly PostgreSQL, as well as have a basic understanding of Python, including creating functions and using loops. It won't cover how to use a scheduler, like Apache Airflow, or set up a cron job; however, once this script is created, you can add it to your preferred workflow scheduler to automate a daily execution.
For Vantage, you'll need at least one provider connected. You'll also need a Vantage API token with READ and WRITE scopes enabled.
Demo: Automate and Visualize Unit Economics
You can find the full script and all demo files in the FinOps as Code demo repo.
Step 1: Create a Business Metric in Vantage
To create the initial business metric, you can create it directly in Vantage, or you can send the following POST call to the /business_metrics endpoint. For the cost_report_tokens_with_metadata parameter, enter the token of the corresponding Cost Report you want the business metric to be displayed on.
Tip: The Cost Report could contain filters for things like infrastructure costs (e.g., specific AWS services) so that you can view all the costs related to running the e-commerce platform. Replace the data in the values object with one or more daily data points.
Note the unique business metric token that's provided in the API response. You will need this token for the next step.
Step 2: Import the Required Packages
Export your Vantage API access token and business metric token as environment variables.
Create a Python script and add the following package imports:
- Use
requeststo connect with the Vantage API. - Use
datetimeto access the current date. - Use
psycopg2to connect with the PostgreSQL database. - Use
osto access environment variables.
Step 3: Create a Function to Query the PostgreSQL Database
Create a function that fetches records from the PostgreSQL database. The function will take in the current_date (defined later), a schema, and a table_name. The function connects to the PostgreSQL database and then executes a query to obtain the metric value for the current date. You can also add additional function parameters or export the PostgreSQL database credentials as environment variables. Include error logic in case the database is unreachable.
Step 4: Create a Function to Send Data to the Vantage API
Create a function that sends data to the Vantage API. The function should take in the business metric token you obtained earlier (the metric_id parameter) and an API payload to structure the API call. Include error logic in case the API becomes unreachable.
Step 5: Set Up a Scheduled Pipeline
In the main block, configure the following steps:
- Retrieve the current date in ISO format.
- Create two variables for the PostgreSQL
schemaandtable_name. - Call the
fetch_ordersfunction using both these variables and thecurrent_date. - Extract the date and total number of orders from the output.
- Create a
payloadobject that takes in the returned data and structures it to the format required by the/business_metricsendpoint in the Vantage API. - Retrieve the previously exported
ORDERS_METRIC_IDenvironment variable. - Call the
update_business_metricfunction, passing in themetric_idandpayloadvariables. - Add error logic in case of API failures or data retrieval issues.
To ensure the script runs daily, you can schedule it as a cron job or configure it to run within another scheduler, such as Apache Airflow.
View Cost Per Order in Vantage
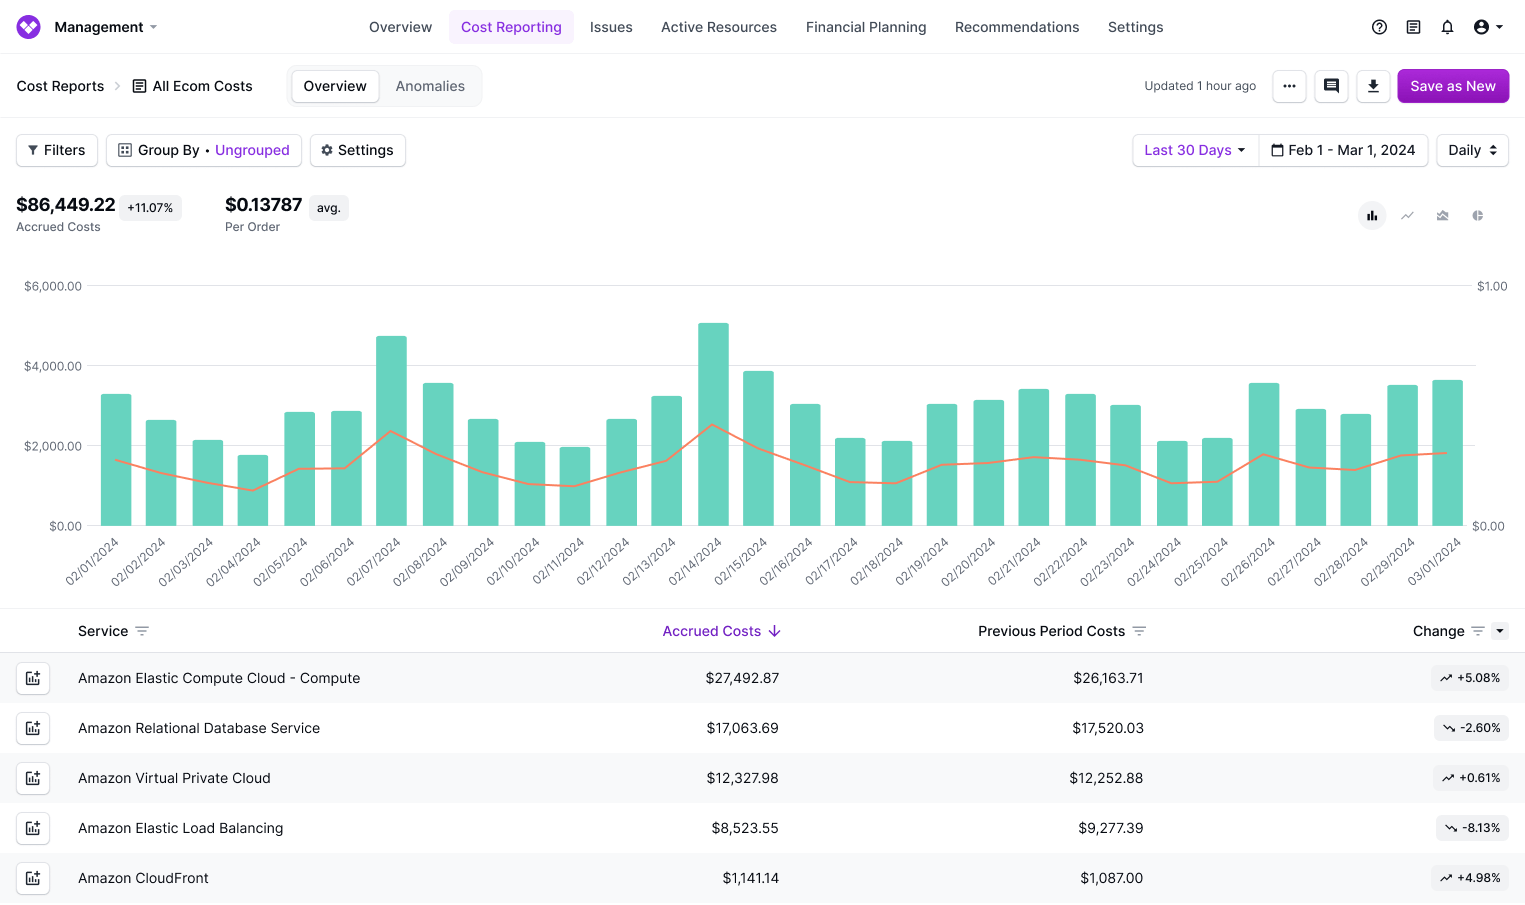
As your metric data is imported each day, you can view it on the corresponding Cost Report you configured in Vantage. In this example, a Cost Report filtered to AWS costs for the e-commerce site shows costs spiking on weekends as well as on 2/7 and 2/14, possibly correlating with increased sales activity. The cost per order rises alongside these spikes in cloud costs. You could consider exploring further correlations or configuring anomaly alerts to manage cost fluctuations and optimize your operational efficiency. This data can help the team to not just view cloud costs but also understand how costs for each order trend in more relatable terms.
Conclusion
Analyzing the correlation between business metrics and cloud costs offers valuable insights for business operations. An automated pipeline like this can help you easily view changes each day.
Sign up for a free trial.
Get started with tracking your cloud costs.