Cloud Cost Report
The Q3 2023 Cloud Cost Report analyzes real-world data to quantify how cloud spending patterns are changing.
Fresh off the quarterly earnings for Microsoft, Google, and Amazon—where companies continue to focus on cost optimization—we are releasing the Q3 2023 Cloud Cost Report, an analysis of cloud usage based on anonymized Vantage customer usage. Vantage is a cloud cost management and optimization platform, with a unique view into industry trends, thanks to tens of thousands of connected infrastructure accounts across 12 cloud providers. To discuss this report in more detail, join our growing Slack Community of over 1,000 engineering leaders, FinOps professionals, and CFOs. View past reports here.
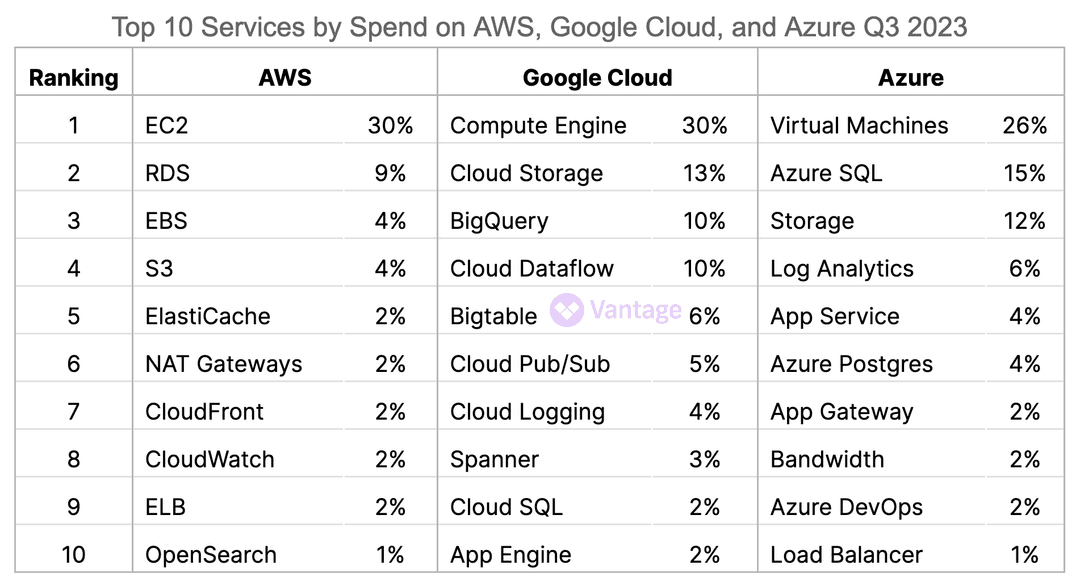
Top 10 Services by Spend Across Clouds
Optimizing cloud costs is a priority for businesses wanting to manage their operations effectively. In our latest analysis for Q3, we revisited the top services across AWS, Google Cloud, and Azure. Compared to Q2, AWS shifted the distribution of costs among services, while Google Cloud and Azure remained identical, showcasing a consistent pattern in expenditure trends.
The biggest shift we've seen from Q1 earlier this year is a 12% decrease in EC2 spend, making compute relatively even across all three providers. This could be, in part, due to users continuing to upgrade to latest generation instance types and a decline in On-Demand spending.
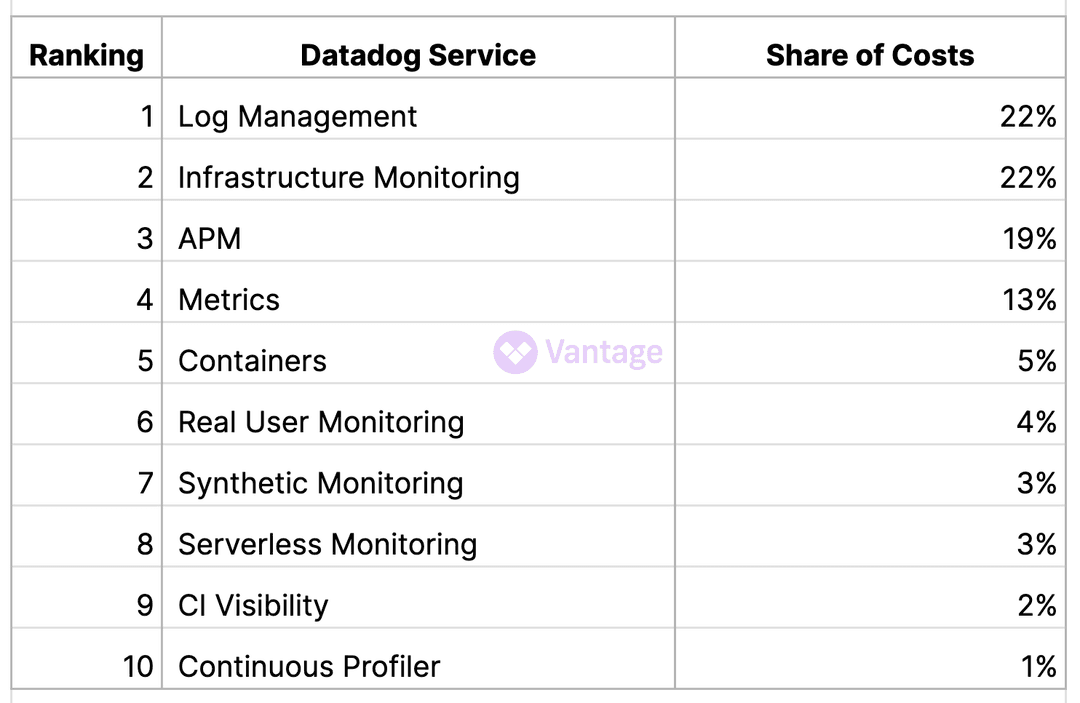
Datadog Growth of Containers and Serverless Monitoring
Containers and Serverless Monitoring increased their joint percentage of Datadog spending to 8%, up from last quarter. This growth reflects the growing trend toward containerization and serverless architectures.
Organizations are increasingly leveraging container technologies, such as Docker and Kubernetes, to streamline deployment and enhance the portability of applications. Simultaneously, the rise of serverless computing, such as AWS Lambda (number 17 on the Cloud Cost Leaderboard), exemplifies the priority for a more efficient approach to managing workloads.
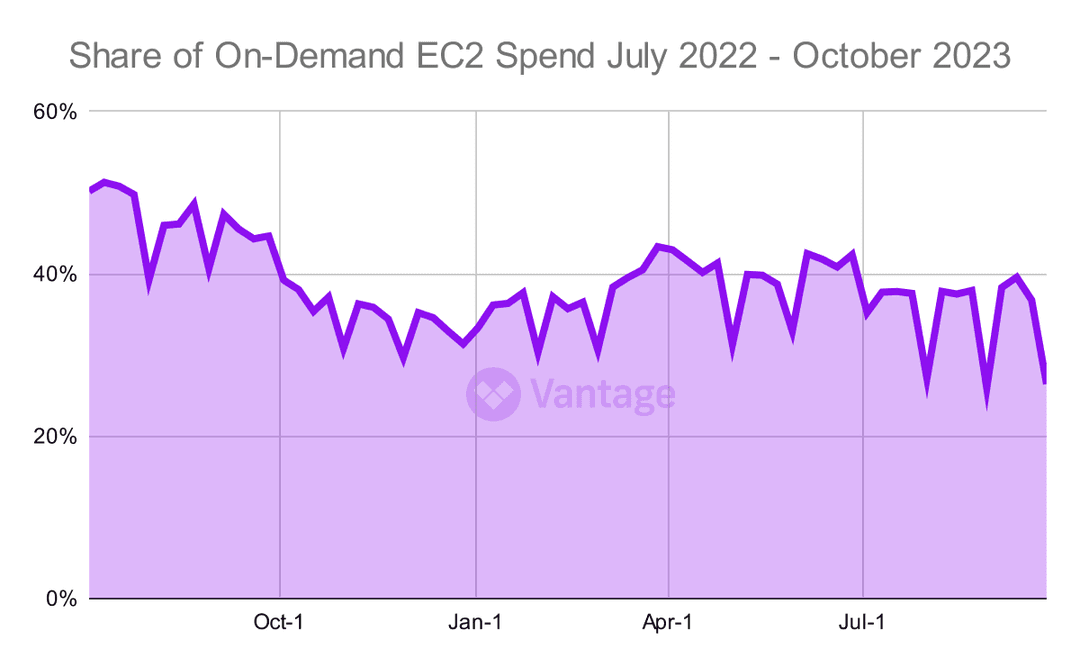
EC2 On-Demand Spending Is on the Decline
EC2 On-Demand spending dropped to an average of 35% in the past quarter. This is a significant improvement from the 47% spending average in the same quarter last year.
Despite weekly fluctuations, the overall trend signals a reduction in On-Demand spending, suggesting effective cost-saving measures and optimization efforts across the board.
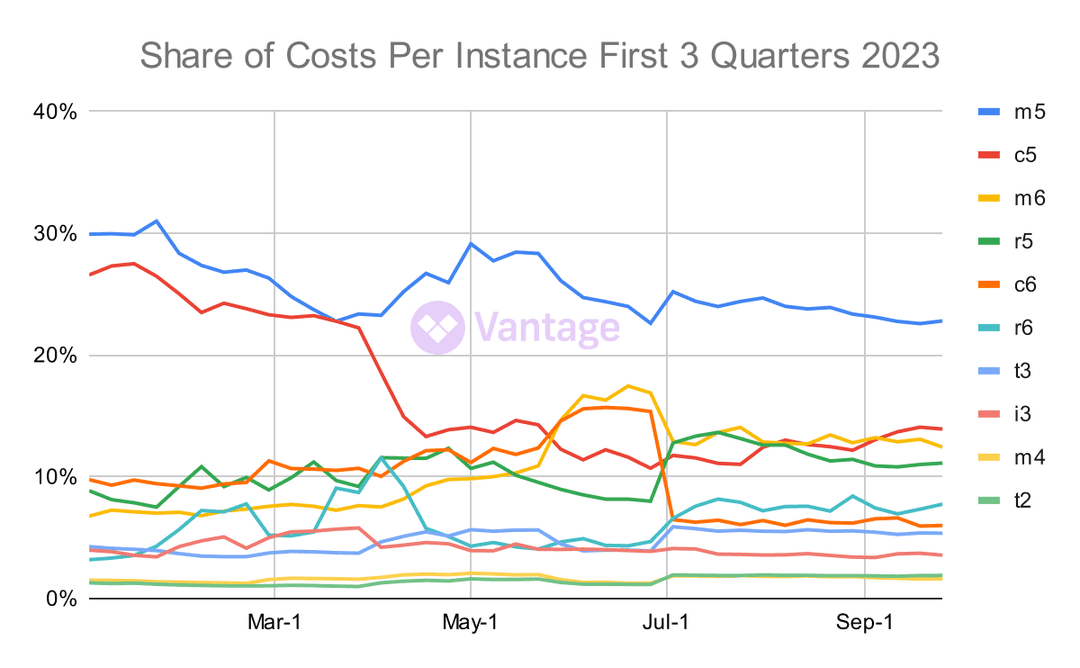
EC2 Users Are Slow to Upgrade to the Latest Generation
The adoption of newer generation instance types is on the rise, but the latest generation instances have yet to make a substantial impact on the overall cost per instance.
This trend is consistent with the pattern observed in the slow uptake of M, C, and R series sixth-generation instances. Last quarter, we noticed a surge of upgrades once the introduction of Intel and AMD instances were added after the initial release of ARM-based Graviton instances. While the seventh-generation M and R series were initially released in February 2023, it wasn't until this August and September the Intel and AMD instances were released.
Despite the effort involved in migrating to the latest generation, there is considerable potential for improvement in both price and performance.
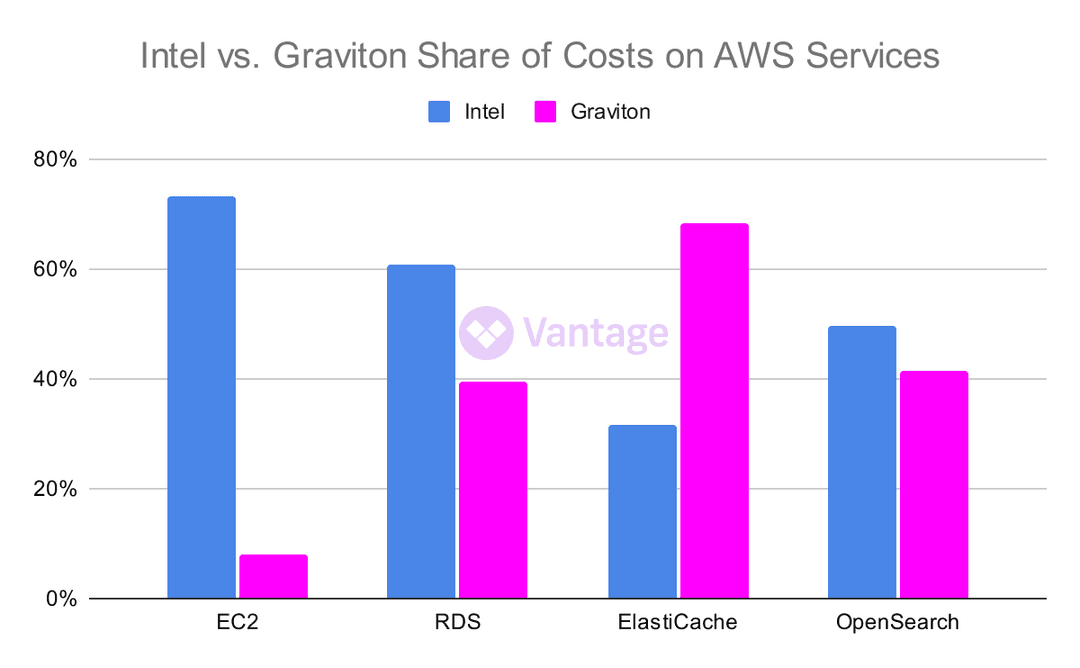
Graviton Hits New EC2 High
Graviton hits a new record of 9% of EC2 costs. Since its launch in 2018, Graviton has slowly expanded its offerings across EC2 instances. Now, every instance family (General Purpose, Compute Optimized, Memory Optimized, Accelerated Computing, Storage Optimized, and HPC Optimized) contains the latest generation instance powered by Graviton processors.
The T series, for example, has the latest generation T4g to rival the Intel-powered T3 and boasts a 40% price performance improvement over T3. C7g, powered by Graviton3 processors, has the best price performance of the Compute Optimized. So it's no surprise customers are considering Graviton-backed instances for their EC2 needs.
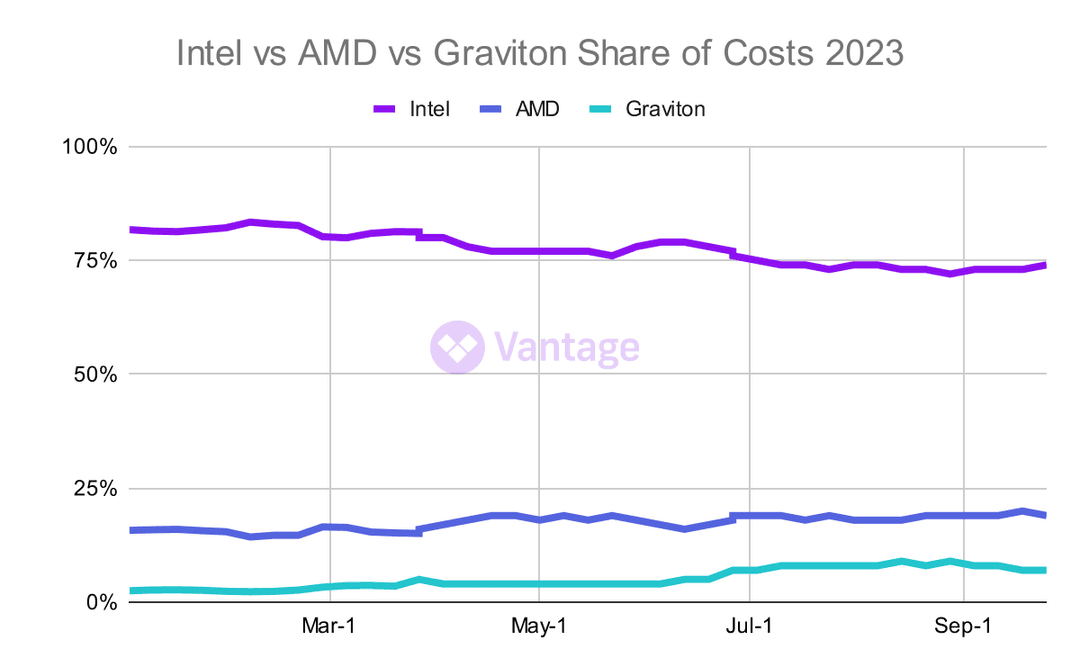
Graviton Adoption Accelerates While Intel Adoption Continues to Decline
In previous reports, we tracked a much higher overall adoption of Graviton. This quarter, we continue to see overall adoption for Graviton increase at an even quicker pace.
While Intel still holds the market share, this quarter saw a much sharper decline for Intel with a hold of around 75%. Intel continues to report decreasing revenues, with third-quarter earnings reporting revenue down 8% year over year. AMD stays steady, continuing to hold around 20% of the compute market share.
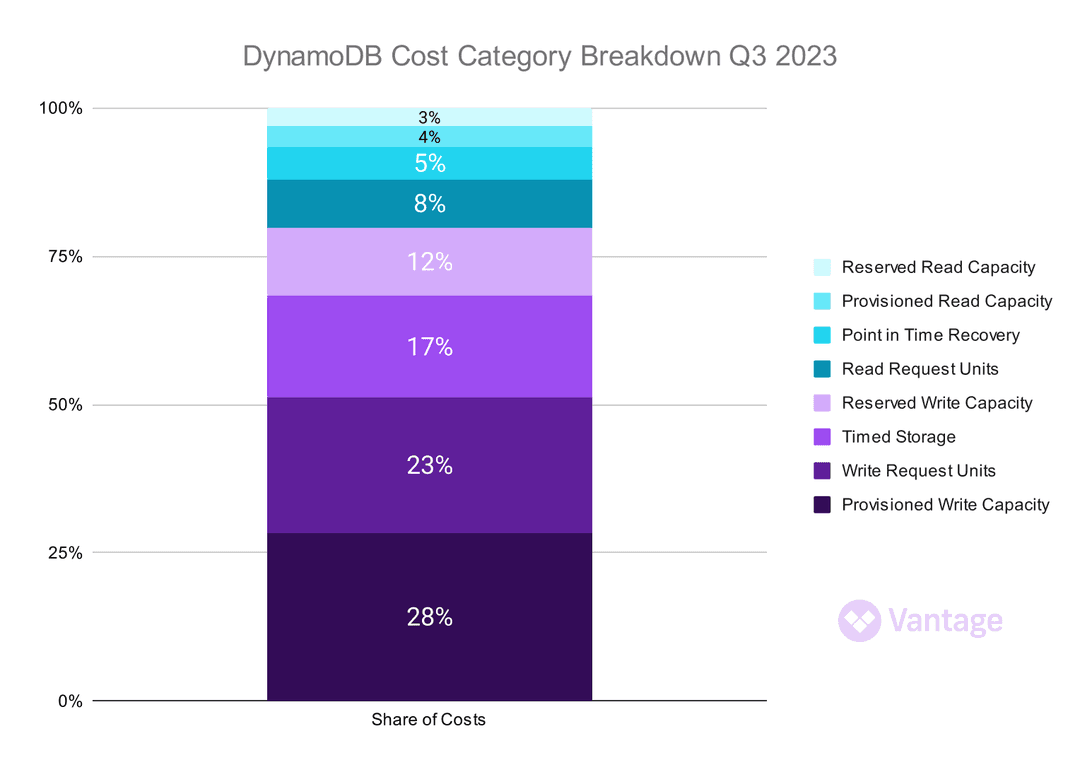
Breaking Down DynamoDB Costs
Amazon DynamoDB is the fifth most costly service on the Cloud Cost Leaderboard—which makes it perfect for analyzing the factors that drive these costs. Users can appreciate recent cost-saving measures, such as a recent AWS release, aimed at lowering the cost of failed conditional writes.
Provisioned Write Capacity and Provisioned Read Capacity represent just over a third of all costs this quarter. Provisioned throughput offers cost advantages when your reads and writes are consistently distributed over time. It is typically the ideal choice for fluctuating or unpredictable workloads, as any activity beyond the provisioned threshold will result in failures.
Other factors, like Timed Storage, represent 17% of costs. This underscores the economic implications of long-term data retention and the need for strategic management of storage resources.
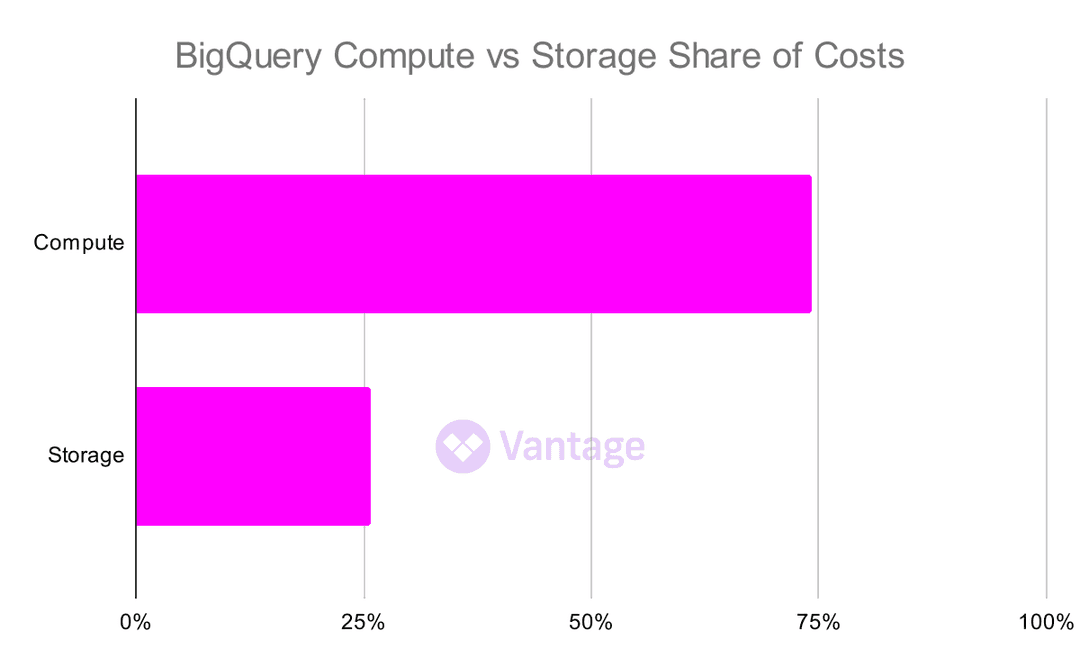
BigQuery Compute Holds the Largest Share of Costs
BigQuery compute accounts for the majority of costs, representing 74% of overall expenditures, while storage costs contribute the remaining 26%. On the compute side of the house, some of this difference may be influenced by new BigQuery editions pricing. Flat-rate pricing was replaced with new editions—like Standard, Enterprise, and Enterprise Plus—aimed at targeting a user's specific workload requirements.
GCP also increased the price of on-demand by 25% across all regions. Cost-conscious users can look for ways to manage compute costs by monitoring expensive queries.
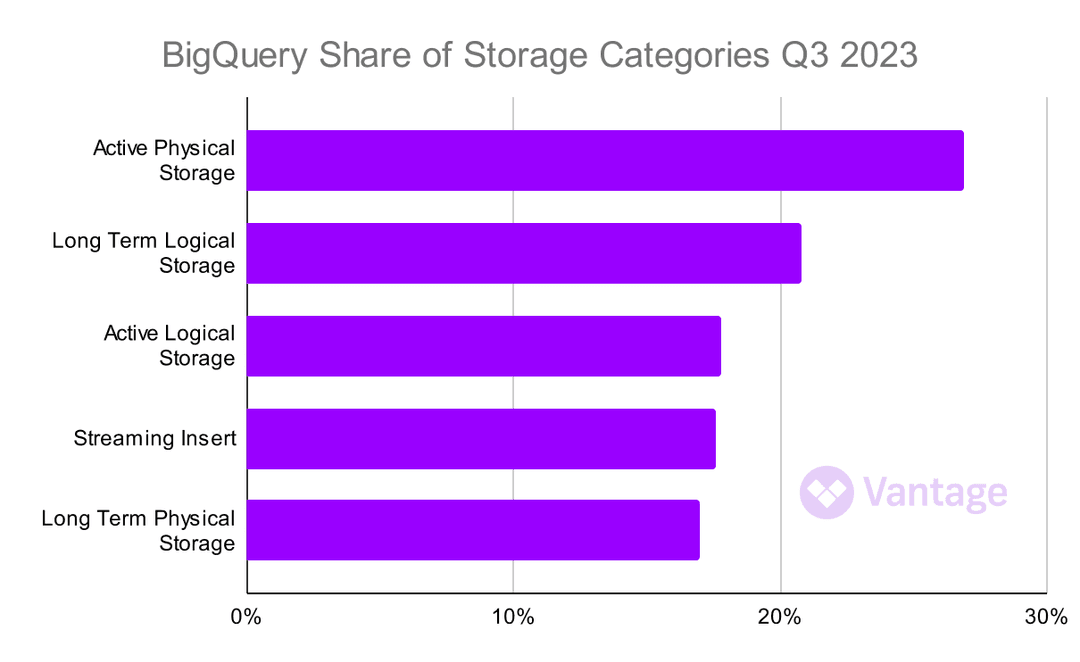
Analyzing the Impact of New BigQuery Physical Storage SKUs
Recent changes to GCP BigQuery storage pricing showcase a shift with focus on "physical storage." The launch of the Active Physical Storage and Long Term Physical Storage SKUs—billed at 2x the rate of logical storage after compression—introduces significant cost reductions for large datasets.
These SKUs represent 44% of this quarter's costs, demonstrating how users are leveraging efficiencies with compression to deliver decreases in overall expenses.