Vantage Launches Usage-Based Reporting
Vantage announces the general availability of Usage-Based Reporting, which allows Vantage customers to view their infrastructure consumption in non-monetary metrics.
Today, Vantage announces the general availability of Usage-Based Reporting, which allows Vantage customers to view their infrastructure consumption in non-monetary metrics, such as virtual machine running hours, stored gigabytes of data, or read/write units consumed. Usage-Based Reporting is now enabled in all Cost Reports for AWS, Azure, GCP, and Oracle. With this feature, Vantage users can now toggle between viewing their consumption by spend or by usage.
Vantage customers utilize their infrastructure usage data to identify additional insights into their consumption and to understand how their usage correlates with their invoiced spend. As users mature in their use of cloud infrastructure, they utilize features such as discounted pricing from bulk usage, committed purchase options, and archival tiering to decrease costs as their usage increases. To understand correlations of cost and usage, Vantage customers previously needed to export both cost and usage data from each provider and manually create reporting on their consumption. This process is time-consuming, human error prone, and difficult to maintain.
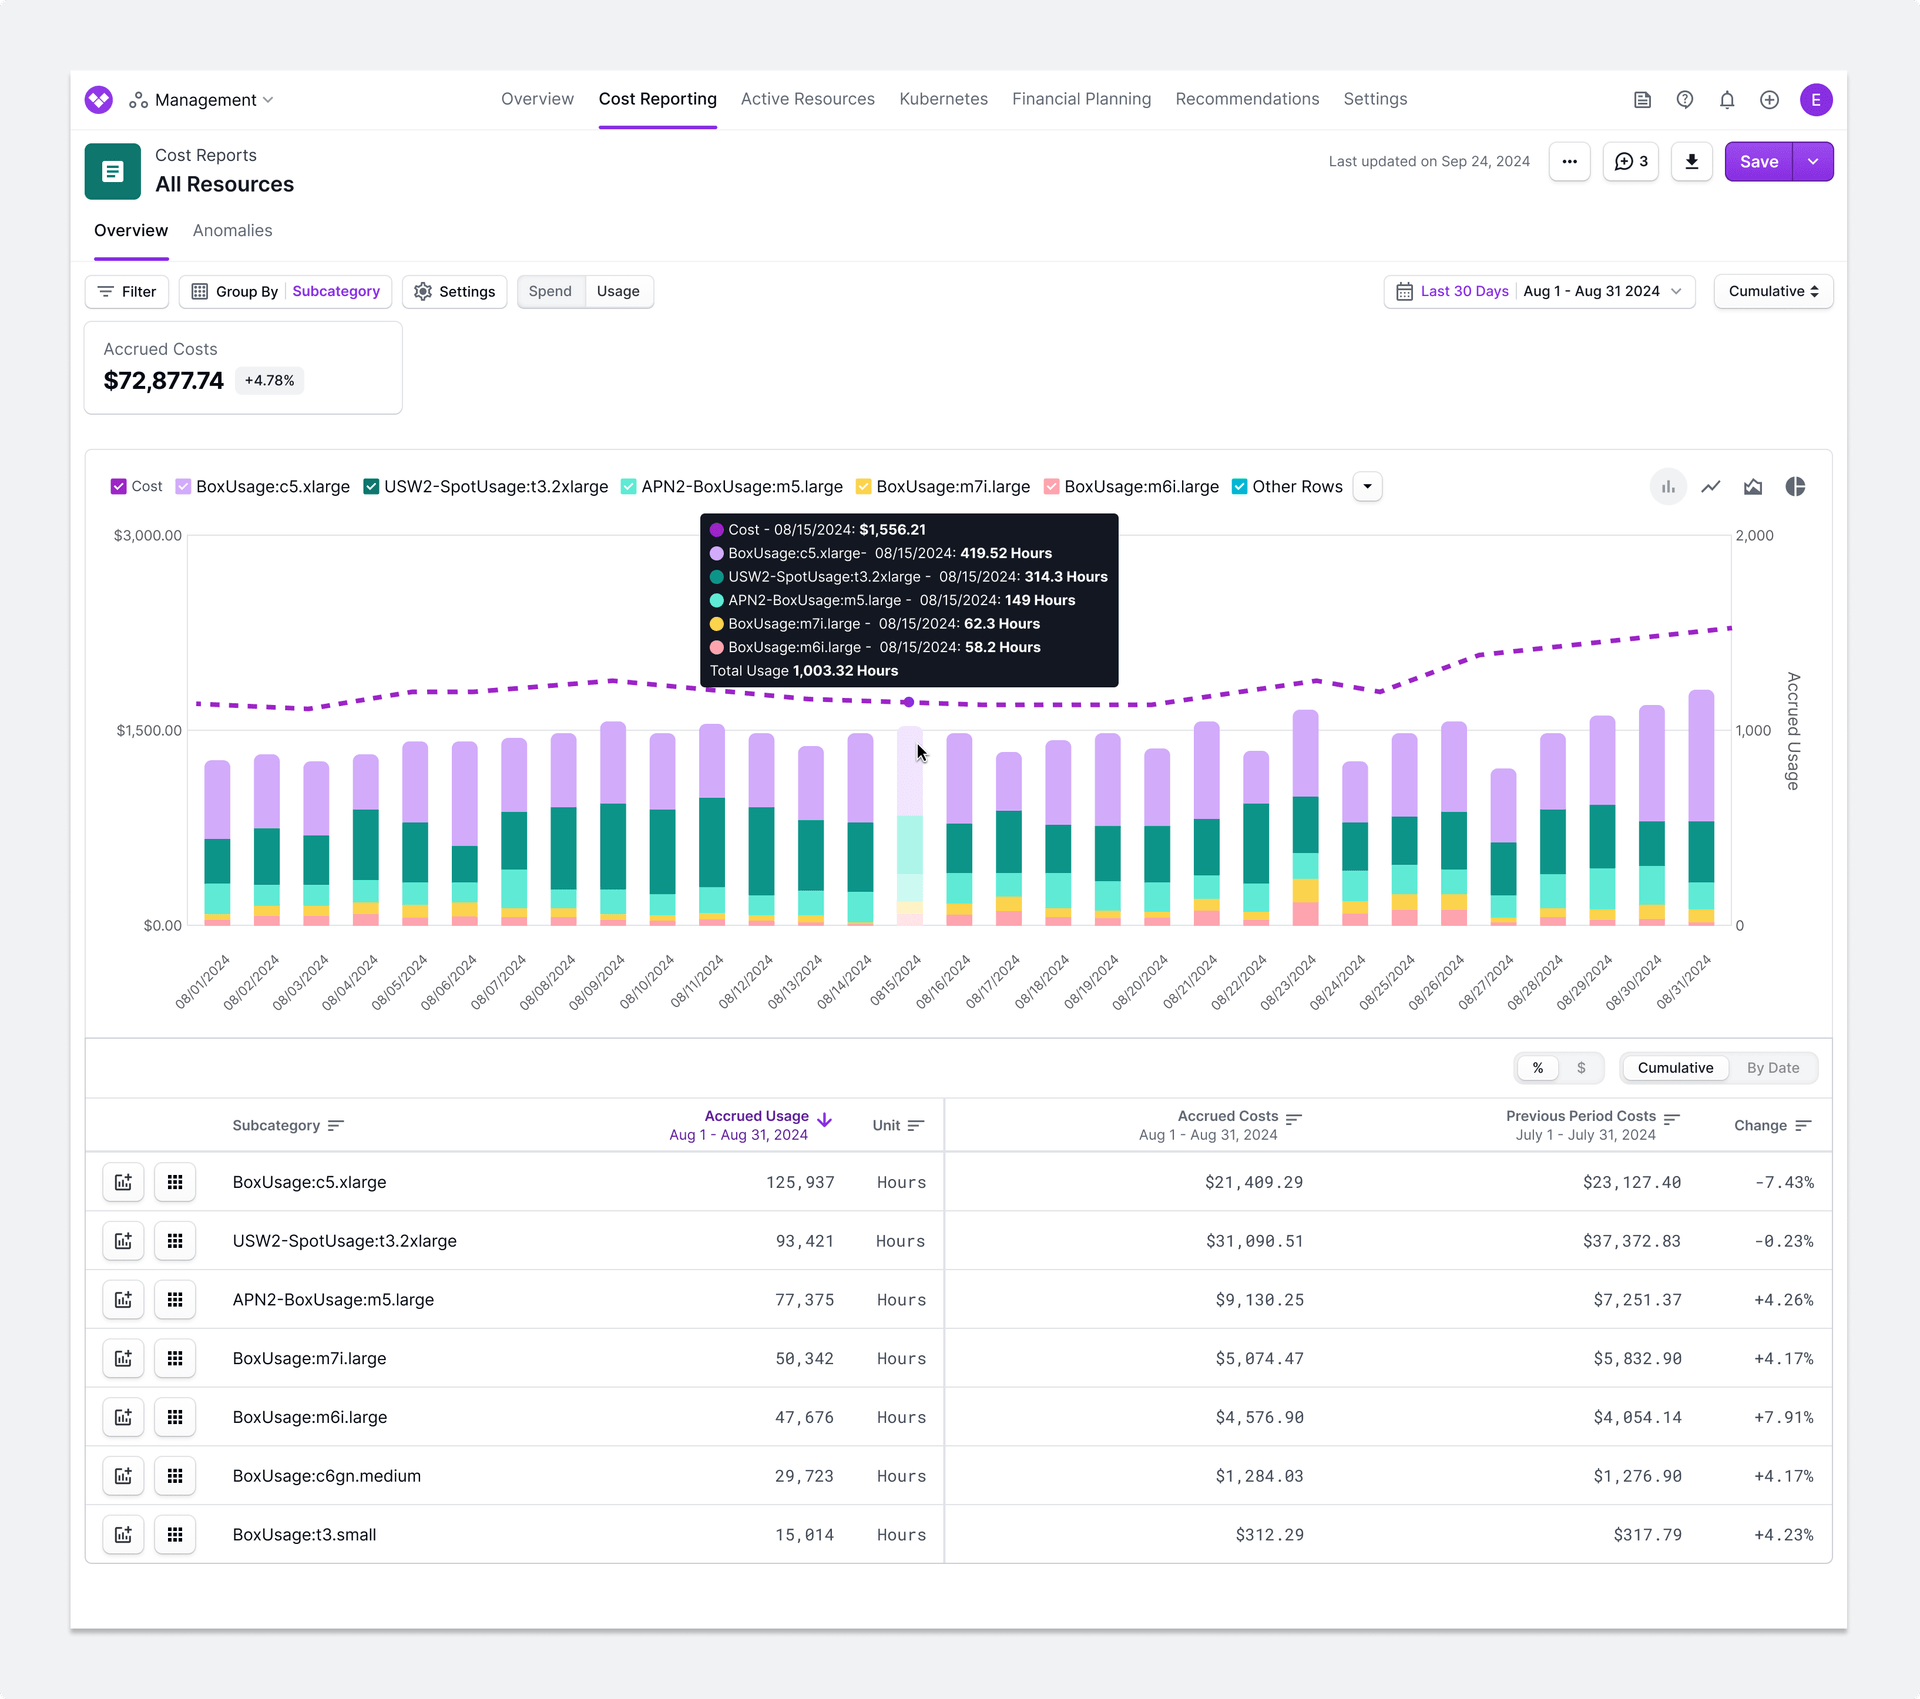
Cost Report displaying AWS EC2 instance hours and associated cost
Now, with the launch of Usage-Based Reporting, customers can view their real-time usage directly in Vantage Cost Reports. Usage-Based Reporting allows users to utilize the same features and functionality they use today to filter and group their costs, such as Virtual Tags, to create tightly scoped reports to view their raw usage abstracted from variable pricing models. For example, when viewing Amazon EC2 costs over time, customers can now toggle to view their consumption in usage quantity and view EC2 instance hours over time. The table below the chart will also update to include the accrued usage and the unit of measure for each line item being viewed.
This feature is now available to all Vantage customers. To get started, navigate to any Cost Report in the console and click the Usage toggle. To learn more about how to get set up, see the Vantage Documentation.
Frequently Asked Questions
1. What is being launched today?
Vantage is launching Usage-Based Reporting: a way for users to view usage-based dimensions for services that providers meter by consumption. You can also view the explainer video below for more details.
2. Who can use Usage-Based Reports?
All Vantage customers can view usage directly within Cost Reports in the Vantage console. Users can toggle between viewing their consumption by cost or by usage within each report.
3. Which providers is Usage-Based Reporting available for?
Usage-Based Reporting will be initially available for AWS, Azure, GCP, and Oracle. Vantage plans to add support for other providers. Please contact support@vantage.sh with any other providers you’d like to see added.
4. How much does Usage-Based Reporting cost?
There is no additional cost for Usage-Based Reporting.
5. Is historical cost data for Usage-Based Reports available?
Any new data ingested into the system will be available for Usage-Based Reporting. If you want this information backfilled for your account, contact support@vantage.sh.
6. What type of usage is available for Vantage users to view?
Any dimension that a provider meters and bills is available through the billing integrations Vantage supports for that provider. Vantage standardizes these dimensions for inconsistencies in unit case and spelling across providers (e.g., hrs, Hrs, hours, Hours).
7. How are different units of measurement treated when viewing usage?
When you switch to usage views, new groupings are automatically added to the current dimensions the report is grouped by for consumption. This is represented by a Usage column that is added in the table, as well as a secondary Y axis on the chart. If a provider does not have usage data, it will appear null if it is included in your Cost Report.
8. Will Vantage Virtual Tags be applied to usage as well as cost?
Virtual Tags work across both cost and usage consumption for supported providers. If you have previously tagged usage based on cost, the associated consumption will also inherit the same Virtual Tag. This will now allow users to be able to apply filter logic to apply Virtual Tags based on usage.
9. Can usage data be viewed in dashboards?
Yes, usage data can be added to dashboards. A Cost Report will be added to a dashboard in the units it is saved in. All previously saved Cost Reports will be shown in Dashboards in the cost view. To add a Cost Report with usage dimensions to a dashboard, save the report when it is toggled to the Usage view, and then add it to the dashboard of your choice.
10. How often does usage data refresh in the Vantage console?
Usage data is refreshed as often as new cost data is ingested into the system.
11. Can I export usage data?
Yes, you can export usage data the same way you currently export cost data. This data is available as the primary value in the exported CSV.
Sign up for a free trial.
Get started with tracking your cloud costs.
Read more
Vantage Expands the FinOps Agent with Anomaly Investigation, Response Feedback, and New Capabilities

Vantage Launches Support for FOCUS 1.3 Imports and Exports
Vantage Adds Support for AWS Blended Commitment Discounts
Vantage Launches LLM Token Allocation in Private Preview