Vantage Launches Resource Reports for Dashboards
Vantage is launching dashboard widgets for resource reports, which provide an at-a-glance view of your most expensive resources and recommended savings.
Today, Vantage is launching dashboard widgets for resource reports. These dashboard widgets provide an at-a-glance view of the most expensive resources and recommended savings, which can be filtered to show a specific tag or account. This feature enables teams to customize a report for their needs and add it to their custom dashboards.
Previously, Vantage users could create dashboard widgets only from Cost Reports, Segment Reports, Kubernetes Efficiency Reports, and Financial Commitment Reports. Users who wanted to better understand costs at the resource level were unable to view resource-specific costs on dashboards. To see recommended savings or track expensive resources, they would have to open the report to see the high-level overview.
Now, customers can add widgets for resource reports to their dashboards. These dashboard components list the top 10 most expensive resources within that resource report. When the report comes from a cost recommendation, additional information is displayed on the widget about the potential savings that are available. FinOps practitioners can use this information as a potential to-do list for optimizing specific resources and creating team or cost-center-specific views.
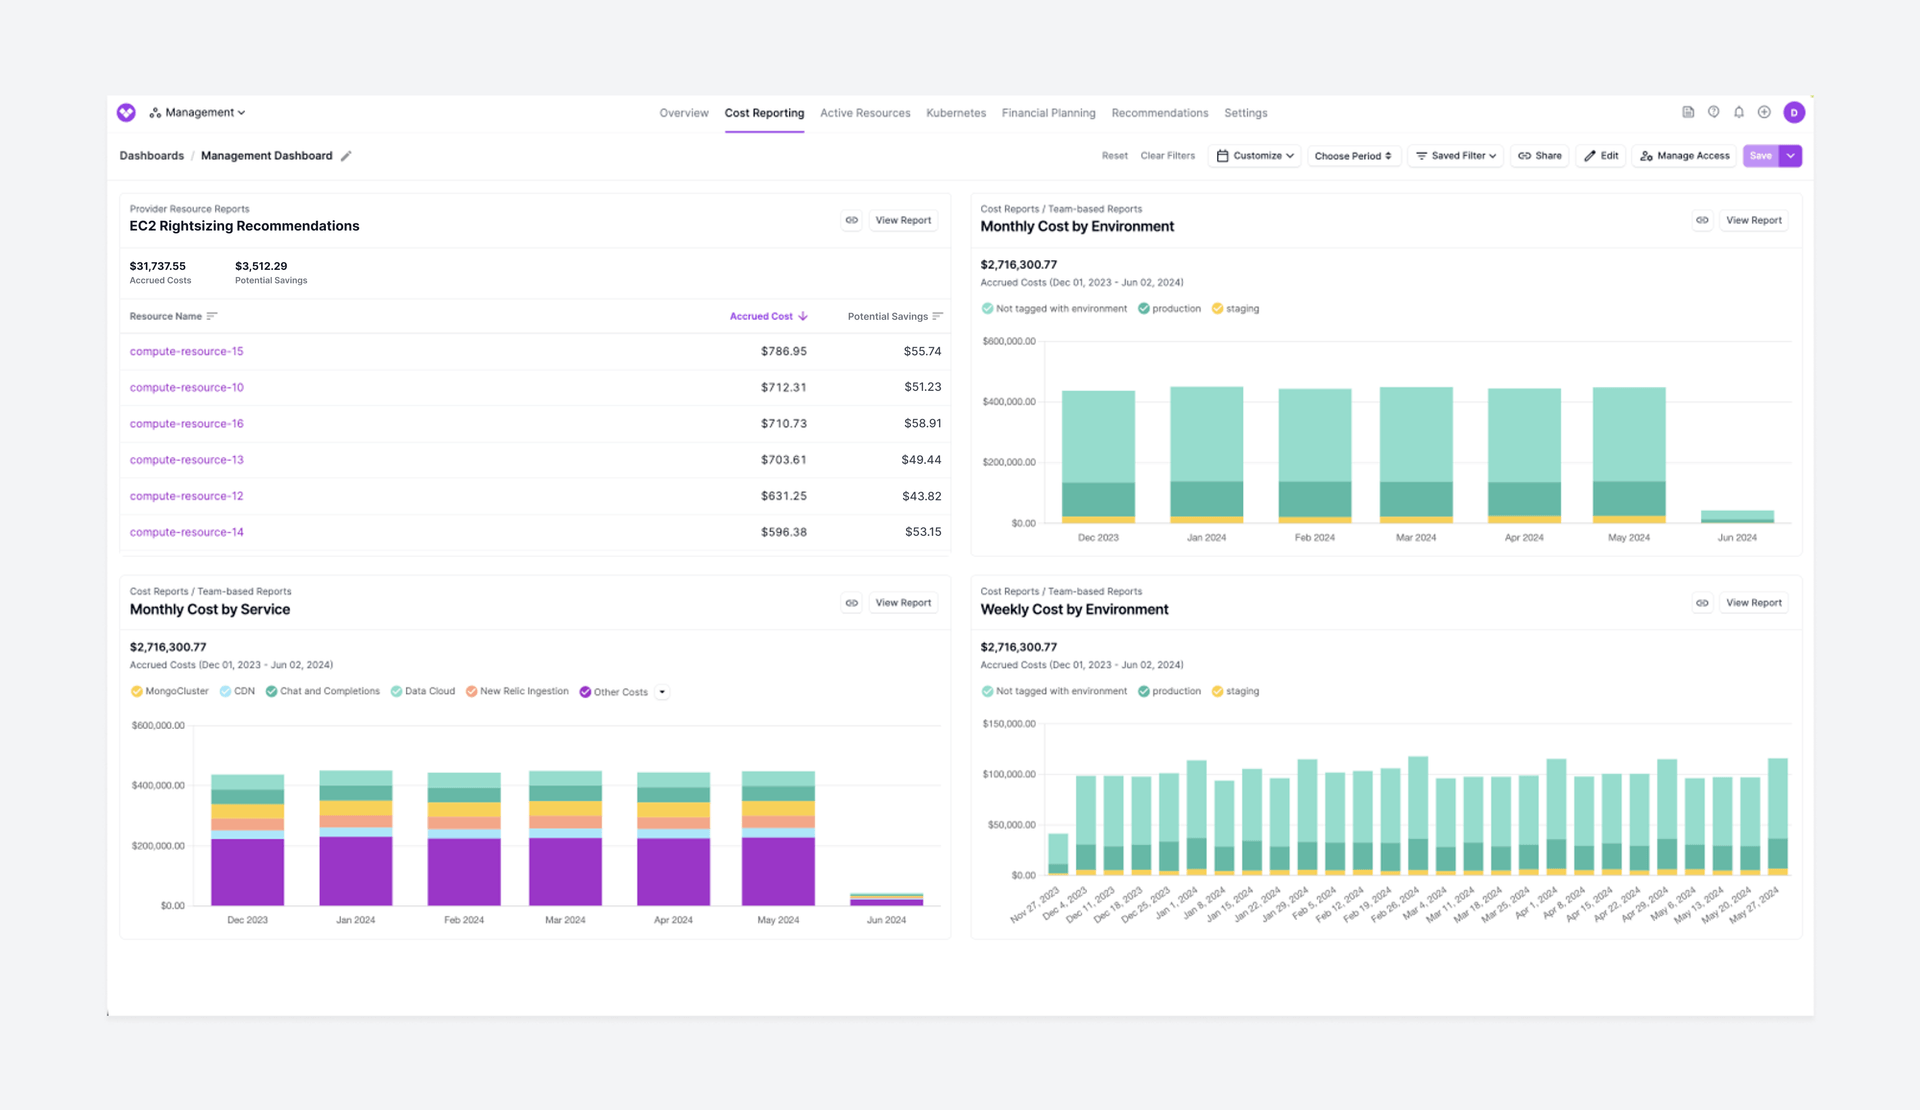
A Vantage dashboard with the new resource report widget
This feature is now available to all users. To get started, navigate to the Dashboards screen. When you create or update a dashboard, existing resource reports will be displayed in the Add Reports dropdown menu. For more information about dashboards, see the documentation.
Frequently Asked Questions
1. What is being launched today?
Vantage is launching a new dashboard component for resource reports.
2. Who is the customer?
The customer is any Vantage user who uses dashboards to view summarized information about the cost of their infrastructure.
3. How much does this cost?
This feature is free to all users.
4. How do I create a resource report dashboard widget?
- From the top navigation, select Cost Reporting > Dashboards.
- To create a new dashboard, click + New.
- Enter a dashboard Name.
- For the Add Reports field, select which reports you want to add to the dashboard. Resource reports are now included in the list of available report options.
5. What permissions do I need to create a dashboard widget?
Users with the Editor role and above can edit dashboards to include resource reports.
Sign up for a free trial.
Get started with tracking your cloud costs.