Vantage Launches Multi-Dimensional Cost Reporting
Cost Reports now support grouping costs by multiple dimensions, such as account and service.
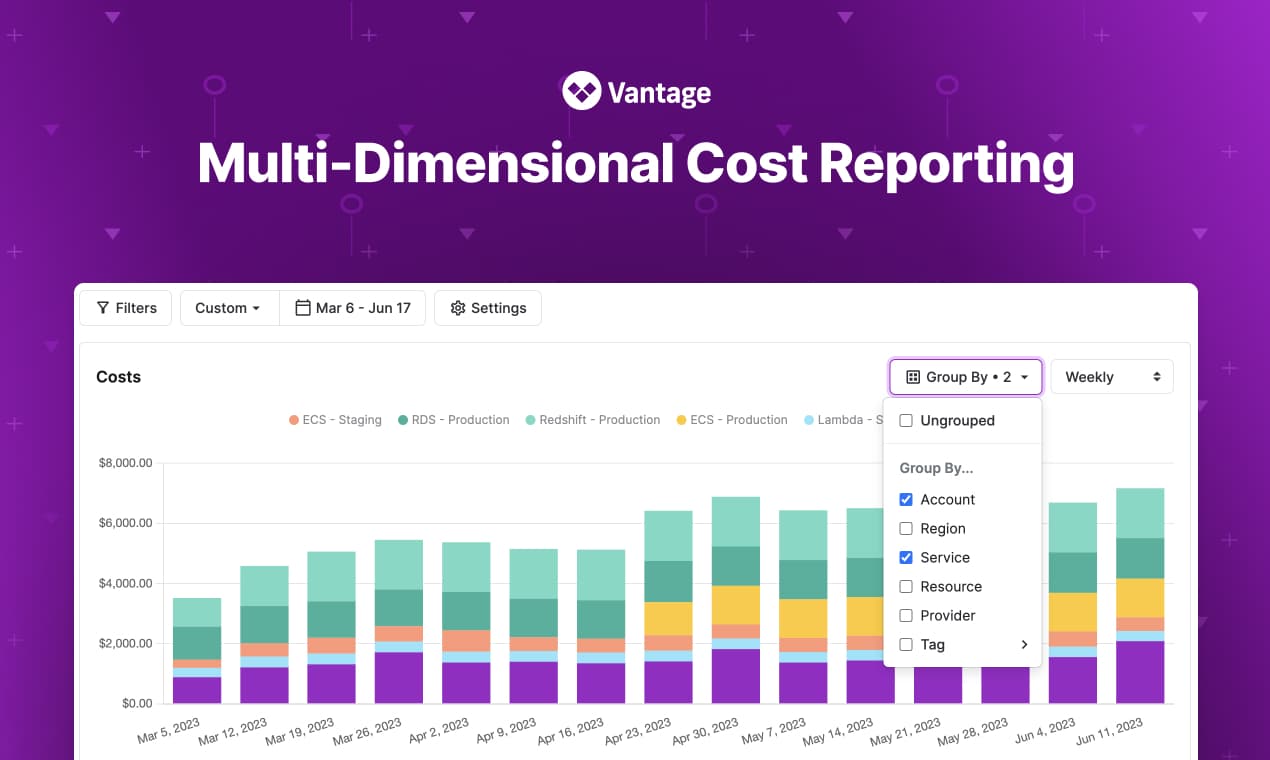
Grouping by the Account and Service dimensions on a Cost Report
Today, Vantage announces the launch of multi-dimensional grouping on Cost Reports. Customers can now select multiple dimensions (such as member account and service) on a Cost Report and have the costs aggregated by the combined selected dimensions.
Before, customers had the ability to group a Cost Report by a single dimension. The available values for the grouping dimension were Service, Account, Region, Resource, Provider, and Tag Key. However, this experience was limited, if you wanted to see a breakdown by multiple dimensions at the same time. For instance, it is very common to break out costs by account and service in order to see how services are trending across different accounts.
Now, customers have the ability to select up to three fields when grouping a report. The “Grouping” component on cost reports has been updated to allow for a multi-selection format, allowing you to choose one or more dimensions to group by. Once selected, both the Cost Report table and graph will display the costs aggregated by the selected groupings. Once the report is saved the report’s corresponding overview widget will be updated as well. Along with the UI, customers can also specify multiple groupings when retrieving costs via the Cost Report API.
This feature is now available for all users, including users in the free tier. Visit any Cost Report to begin creating multi-dimensional reports.
Frequently Asked Questions
1. What is being launched today?
Today, Vantage is launching multi-dimensional groupings on Cost Reports: the ability to select multiple fields to aggregate costs.
2. Who is the customer?
The customer is any Vantage user who wishes to analyze costs grouped by multiple dimensions.
3. How much does this cost?
There is no additional cost for multi-dimensional groupings.
4. What fields can I select when grouping a Cost Report?
- Account (i.e. member account on AWS, project on GCP, etc.)
- Service (i.e. AWS S3, etc.)
- Provider (i.e. AWS, GCP, Azure)
- Region
- Resource
- Tag Key
5. Can I group by multiple tag keys?
No, grouping by multiple tags will not be supported. As costs can be duplicated across multiple tag keys. If you have a use case for this please contact support to discuss.
6. How do I view multi-dimensional aggregations via the Cost Report API?
When making a request to the API you can pass in multiple values for the grouping parameter. When doing this, each grouping will have its own field in the response object.
An example when grouping by service and region:
7. Can I view costs by category or resource for a multi-dimensional grouping?
At this time you can not drill down into a multi-dimensional grouping to see costs by category or resource, however, this is on our roadmap.
8. Can I use multi-dimensional grouping if I only have AWS Cost Explorer enabled?
No, unfortunately, without Cost and Usage reports enabled for AWS, you will be unable to group reports by multiple dimensions. The Cost Explorer API is limited to two aggregations.
9. How are costs displayed in the table when grouping by multiple dimensions?
Each selected grouping will have its own column in the table. When selecting a grouping in the table it will be displayed in isolation on the graph.
10. How are costs displayed on the graph when grouping by multiple dimensions?
Each row of grouping will have its own section on both the bar and stacked area graphs. The label will be displayed with dashes between the groupings. e.g. “grouping 1 - grouping 2 - 2023/06/01: $500”
11. Are multi-dimensional groupings respected when performing a basic report export?
Yes, any multi-dimensional groupings saved for a report will be present in the basic report export.
12. Can I see a forecast for each aggregation?
No, we do not currently support forecasts on grouped cost reports, but this is on our roadmap.
13. Can I sort the cost report table by multiple columns?
Yes, you can shift-click on column headers to select multiple columns for sorting.
Sign up for a free trial.
Get started with tracking your cloud costs.
Read more
Vantage Launches Preferred Tags: Make Your Most-Used Tags Visible to Your Organization

Vantage Launches Support for Redis Costs
Introducing Vantage in ChatGPT
Vantage Expands the FinOps Agent with Anomaly Investigation, Response Feedback, and New Capabilities