Vantage Launches Grouped Charts
Today Vantage announces the launch of “Group By” functionality on Cost Reports. This gives customers the ability to group cost data by dimensions such as AWS Service, AWS Account or GCP Project...
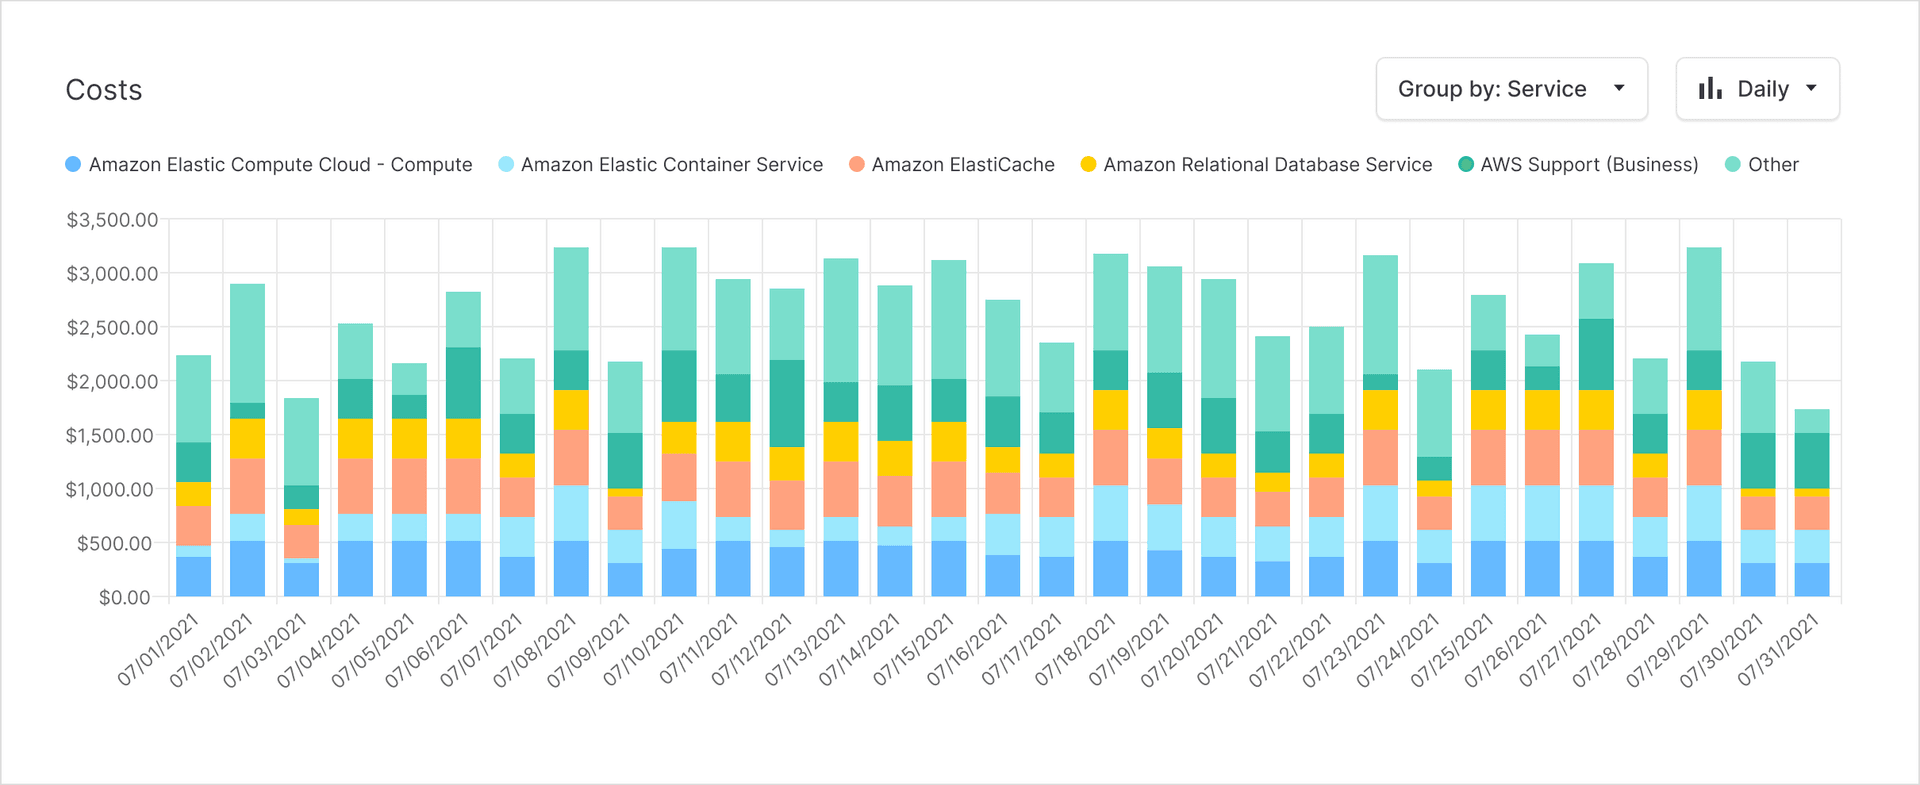

An example of "Group By" functionality in a Vantage Cost Report
Today Vantage announces the launch of “Group By” functionality on Cost Reports. This gives customers the ability to group cost data by dimensions such as AWS Service, AWS Account or GCP Project, Infrastructure provider and more. A new “Group By” toggle will be present when viewing costs in a Cost Report with a list of available dimensions that are available for the current Cost Report.
Before, Vantage offered two different chart types: Cumulative and Daily. Cumulative charts gives customers the ability to see cost trends for the current month, previous month and a forecast for where the costs are projected to be for the end of the current month. Daily charts gave users the ability to see total accrued costs incurred by day but didn’t give visibility into dimensions that ultimately were the main contributors of those costs. In the event there was an anomalous day, it could take a long time to track down where those costs originated.
Now, all Vantage users have a new “Group By” toggle to split the costs in the Daily chart view on costs reports by a particular dimension. Vantage will automatically provide a list of available dimensions which users can choose to group costs by. When one dimension is selected, the chart will update to show a breakdown by that dimension in the bar chart. Customers can also click on a specific day and see the values in the table update just for that respective day selected, grouped by the dimension.
To get started with “Group By” functionality click on any Cost Report from within your Vantage console at https://console.vantage.sh/
Frequently Asked Questions
1. What is being launched today?Today Vantage is launching “Group By” functionality which allows customers across all tiers, including the free tier, to segment costs in costs reports by available dimensions. See below for a complete list of available dimensions.
2. Who is the customer?“Group By” functionality is available to customers in all tiers including the free tier. This functionality is available to everyone at the time that this blog post has been published.
3. How much does this cost?There is no additional cost to “Group By” functionality.
4. How do I use “Group By” functionality?Head to any Cost Report on Vantage, select “Daily” as the chart type and a “Group By” drop-down will become available providing you with a list of dimensions which you can group by.
5. What are the list of available dimensions that I can group by on a cost report?Below are a list of all the possible dimensions at this time.
- Provider (i.e. AWS, GCP, Azure - when viewing a Cost Report with more than one provider present.)
- Account (either AWS Account / GCP Project)
- Service
We are going to be expanding this list of dimensions over time and will update this blog post as new dimensions are available.
6. Can I have “Group By” functionality present for summaries included within the “Overview” section of the Vantage console?Not at this time, no.
7. Are “Group By” settings saved when I save the report or just when I am viewing it?Just when you are viewing it. Though your "Group By" view will be present in the URL as a query parameter so you can share the URL with others and they can see the same view as you.
8. Is there a limit to the number of segments shown on a stacked bar chart?Yes. Vantage will default to showing the top 5 segments and group everything else into an "Other" category. You can also click on the individual table rows in the Cost Report table to see just that segment.
9. If there are a lot of values that are de-minimis, will Vantage group them into an “Everything Else” category so that the chart is not overwhelming?Yes. Vantage will group the long tail of de-minimis categories into an "Other" category to show as one segment on the chart.
10. Is the data table on the report aggregated the same way as the group by?Yes, whatever is selected as the group by will be the key for each row. As often as you toggle "Group By" for a particular dimension, you'll see the table update accordingly.
Sign up for a free trial.
Get started with tracking your cloud costs.